
Your planogram is the plan. The shelf is the reality. Close the gap automatically.
A monitoring system that continuously checks shelf state against your planogram, distinguishes critical violations from acceptable deviations, and gives merchandising teams a network-wide view of which stores follow the plan.
Discuss a pilot →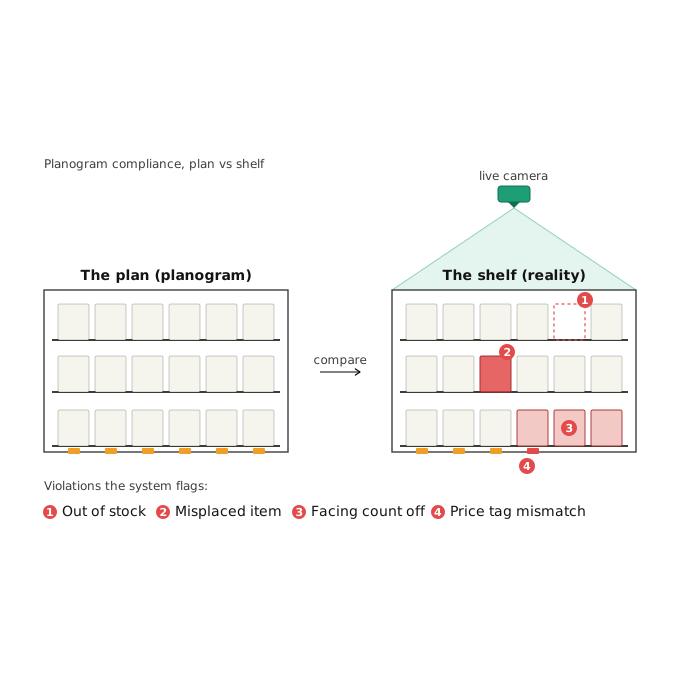
Quick facts
- Business size
- Multi-store retail chains (20+ locations), brand owners with merchandising contracts
- Timeline
- 2-4 weeks test, 1-2 months pilot, 3-6 months network rollout
- Budget range
- Custom, scoped per project. Often runs alongside shelf-monitoring deployment.
- Hardware
- Existing CCTV or dedicated cameras; pairs with shelf-monitoring infrastructure.
- Data needed
- Planogram source (your master), SKU catalogue with reference images, store-by-store layout where it differs.
- Evolution
-
- Genesis
- Custom-built
- Product
- Commodity
A vendor sells this result ready-made. We set it up and tune it to you.
What this scale means
Further right means more proven and cheaper. Further left means newer and riskier. Here is the test for each step.
- Commodity
- You could get the result yourself from a ready service, with almost no work. We rarely take these on.
- Product
- A vendor already sells this result turnkey, like shelf recognition from Trax or document reading from ABBYY. If one of them fits you, use it. You come to us when it does not: when it has to run on your own servers, cost less, or fit systems the product cannot reach.
- Custom-built
- Vendors sell only the parts. A tool like Tableau hands you charts, but the dashboards and metrics for your business still have to be built. That build is the work, and that is us.
- Genesis
- The approach exists but does not work reliably yet. You are betting on it maturing, so it costs more and carries more risk.
Expected outcomes
What Planogram Compliance Is
Planogram compliance is how closely a store’s actual shelf matches the planogram, the layout head office designed for it. A shelf counts as fully compliant when four conditions hold:
- Product presence, every planned SKU is actually on the shelf.
- Facing count, each product shows the planned number of facings to the shopper.
- Shelf sequence, products sit in the planned left-to-right and top-to-bottom order.
- Price accuracy, the shelf tag matches the planned price and promotion.
Retailers measure it three ways: a store-walk audit with a checklist, staff photos sent to a manager, or computer vision that checks every shelf on a schedule. An audit gives a snapshot of yesterday. Continuous monitoring catches drift within hours. In our pilots, compliance typically rises 20-35 percentage points across the first stores once monitoring is in place. The gain depends on how far the chain started from its own plan.
The Problem
A planogram is the blueprint of what goes where on every shelf. It sets eye level for adults against eye level for children, how many facings each product gets, which products sit next to each other, and what lighting falls on the display. It is the shared map between the merchandising team and the store floor.
In theory it keeps shelves organized. In practice it breaks down constantly:
- Suppliers fail to deliver, or deliver insufficient quantities.
- Products sell out and don’t get restocked for hours.
- Shoppers leave items in the wrong place after changing their minds.
- New promotions arrive faster than planogram updates.
- Store staff arrange products the way that suits them, and the plan slips.
- Brand merchandisers visit stores at different times and push competitors’ products aside to expand their own shelf space.
The cost: an empty shelf is a lost sale, a misplaced product is a lost conversion, a broken promo display is a brand-contract penalty. The conventional fix is periodic manual audits. That gives you a snapshot of yesterday’s state. By the time you read it, the shelf has changed again.
What the Solution Does
Continuous comparison between the ideal planogram and the actual shelf layout. The system runs on the camera infrastructure you already use for shelf monitoring. It adds a layer that knows what should be where, then flags every mismatch.
- Ingest, read your planogram (per-store, per-section) from your master source.
- Capture, cameras photograph shelves on a schedule.
- Recognize, match each visible product to your catalogue, identify position.
- Compare, check the recognized layout against the planogram.
- Classify the violation, out-of-stock, misplacement, wrong facing count, missing promo material, brand-contract violation.
- Prioritize, distinguish critical issues (out-of-stock bestseller, broken promo display) from acceptable deviations.
- Alert and analyze, real-time alerts for critical issues; analytics layer for systemic patterns.
Where It Fits
This makes sense if you…
- Run a retail chain with documented planograms enforced across multiple locations
- Have brand-merchandising contracts that specify shelf allocations
- See repeat layout violations and want to know which stores, which categories, which times
- Already invest in shelf-monitoring infrastructure or plan to, this layer plugs in cheaply
- Have a category management team that will act on the analytics
This is probably not the right time if you…
- Don’t have a documented planogram, there’s nothing to compare against
- Allow store-level layout discretion as a policy, automation against a non-enforced plan creates noise
- Operate at small scale (single store, no brand contracts), manual checks suffice
- Have not solved upstream shelf-monitoring data quality first (build that layer first; planogram analytics sits on top)
Business Value
The hard ROI shows up in three places. The one that pays back fastest is often the surprising one.
Brand contract enforcement. If you run promos or hold brand contracts that specify placement, planogram analytics is where the system pays for itself first. Compliance typically jumps 20-35 percentage points within the first pilot stores. Each percentage point feeds directly into negotiated rebates and brand-contract maintenance.
Systemic problem discovery. This is the surprising value. The analytics layer flags individual violations, then shows you the patterns behind them: where layout errors happen most often, which products get misplaced, what times violations tend to occur. Sometimes the answer is that staff got it wrong. Sometimes the planogram itself is wrong: inconvenient for customers, or impossible for staff to maintain. The data tells you which.
Faster reaction to demand spikes. Planograms are updated monthly; trends can last days. When a TikTok video spikes demand for an energy drink, manual processes catch up by the time the hype is over. The monitoring system catches the empty-shelf reality within hours and flags it for emergency restocking.
How It Works
The architecture sits on top of shelf-monitoring infrastructure. If you already have cameras and a CV stack on your shelves, planogram analytics is a software-only addition.
1. Planogram ingestion
We connect to your planogram source, most retail chains have it in JDA, Spaceman, Relex, or an internal system. Per-store overrides (regional adjustments, in-store-format variants) get respected; the comparison happens against the specific plan for each store.
2. Shelf-state recognition
Per-shelf, per-camera output from the shelf-monitoring layer: which products are visible, in what positions, with what facing counts.
3. Comparison engine
For each shelf zone:
- Product present? matches the plan?
- Facing count matches?
- Adjacency rules respected (no chocolate in the kids’ section, etc.)?
- Promo material present where required?
Each mismatch becomes a typed violation event.
4. Severity classification
Not all violations matter equally. A bestseller out of stock is critical. A 2-facing item showing 1 facing in a corner shelf is acceptable. The system applies your business rules (configurable per project) to prioritize.
5. Analytics layer
Aggregated reporting on violation patterns: which stores, which categories, which times of day. This is what category managers and brand teams actually use day-to-day.
Stack
The CV recognition layer is shared with automated shelf monitoring, YOLO family, ResNet, Datapipe for incremental retraining. The planogram comparison and analytics layer is a custom service (Python and FastAPI), integrated with your existing BI tool (Metabase or PowerBI).
What You Need to Make This Work
Data. A planogram master that’s actually maintained (this is the critical prerequisite, a stale planogram poisons the analytics). Per-store overrides if your chain runs different layouts in different formats. SKU master with reference images (shared with shelf-monitoring).
Integrations. Read access to your planogram system. The shelf-monitoring infrastructure (cameras, CV stack). A target for alerts (mobile app for store managers, dashboards for category teams, ticket queue for facilities).
Hardware. Shares hardware with shelf monitoring. No additional camera spend unless your existing coverage misses promo end-caps.
Team. A category-ops lead who owns the priority rules and the response workflow. Store managers who treat alerts as a normal part of the day. If alerts read as a top-down audit threat, the rollout stalls, so this is a change-management question worth taking seriously.
Implementation Roadmap
1. Test (2-4 weeks)
The test phase typically piggybacks on the shelf-monitoring test. We pick 1-2 stores and 1-2 categories with rich planograms, then check that recognition and comparison produce accurate violation events. Output: a written report with measured violation rates against your historical audit data, plus recommendations for severity rules.
2. Pilot (1-2 months)
Roll out across 3-10 stores. Tune severity rules with category managers. Build the dashboards for the analytics layer. Output: a working alert workflow, dashboards in active use by category and brand teams, and a go/no-go on full rollout.
3. Scale (3-6 months)
Network-wide rollout. Quarterly review of severity rules and planogram quality. By the end your team owns the analytics; we stay on for retraining cycles tied to assortment churn.
Keep in Mind
Limits and dependencies:
- The plan must be enforced policy. If store managers have informal license to override the planogram, the system turns into a source of conflict between category management and operations. Decide that question before deployment.
- Stale planograms produce noise. If your planogram master isn’t kept current, the analytics will be full of false violations. Fixing the planogram process is sometimes the step that pays back most.
- Severity rules need real care. Without good prioritization, the system produces hundreds of low-importance alerts and trains staff to ignore everything. We spend real time on severity calibration during pilot.
- Some violations are correct, and your data will reveal that. “TikTok effect” demand spikes can make the planogram wrong. The system surfaces these. What you do with them is a merchandising decision. The CV layer only points to the gap.
- Detection accuracy in the underlying CV layer is the ceiling. Planogram comparison can’t be more accurate than recognition. The “Keep in Mind” notes from automated shelf monitoring apply here too.
FAQ
What is planogram compliance?
Planogram compliance is how closely the actual shelf matches the planogram, the layout head office designed. It covers four things: product presence, facing count, left-to-right sequence, and price-tag accuracy.
What are the four levels of planogram compliance?
Four conditions:
- Product presence: the SKU is on the shelf.
- Correct facings: the right number of each item faces out.
- Shelf sequence: products sit in the planned order.
- Price accuracy: the tag matches the planned price and promotion.
A shelf is fully compliant only when all four hold.
How is planogram compliance measured?
Three ways: a person walks the floor with a checklist, staff photograph shelves for a manager, or computer vision checks every shelf on a schedule. Audits give a snapshot of yesterday. Continuous monitoring catches drift within hours.
How much can better planogram compliance improve results?
It depends on how far the chain starts from its own plan. In our pilots, compliance itself rises 20-35 percentage points across the first stores. The revenue effect varies by category and by how much of the gap was lost sales versus brand-contract penalties.
Do you support multiple planogram standards (JDA / Spaceman / Relex / spreadsheets)?
Yes. The comparison engine ingests from whatever source you maintain. We’ve worked with JDA, Spaceman, Relex, and home-grown systems including Excel masters.
Can the system handle per-store planogram variants?
Yes, that’s standard. The comparison runs against the specific planogram for each store. There is no single chain-wide ideal in the way.
What happens when we update the planogram?
The system reads the new version on its next sync cycle (typically nightly). Mid-day updates can trigger immediate refresh if your operation requires that cadence.
Can we use this for brand-side audits (without owning the retail chain)?
Yes, if you have camera access. Some FMCG brands deploy this in partnership with retailers as a brand-funded compliance layer. The unusual part is the contract structure. The technology does not change.
How is this different from “just” shelf monitoring?
Shelf monitoring tells you what’s on the shelf. Planogram analytics tells you whether that matches what should be on the shelf, and surfaces the patterns. They run on shared infrastructure and answer different questions for different teams.
Ready to Discuss?
If you have planograms that are enforced policy and a category management team that needs network-wide visibility, this is the right conversation. We’ll look at your current audit process, your planogram master, and your brand-contract obligations. Then we tell you whether the pilot is worth running standalone, or whether it should pair with shelf monitoring as a single deployment.