
Inside realgram: scoring a shelf position
Realgram is the layer that uses what was recently labeled at a shelf spot to break ties the embedder cannot. The embeddings and realgram note introduces the idea. This note is the scoring in detail: how the probability is built along the shelf, how it combines with the embedder, and where it fails.
A planogram is how a shelf should look. A realgram is what we actually saw there recently. When two SKUs sit a hundredth apart in cosine, the embedder is blind to the difference in volume or text. Realgram says the same product stood at this spot for weeks, and that breaks the tie.
Building the probability along the shelf
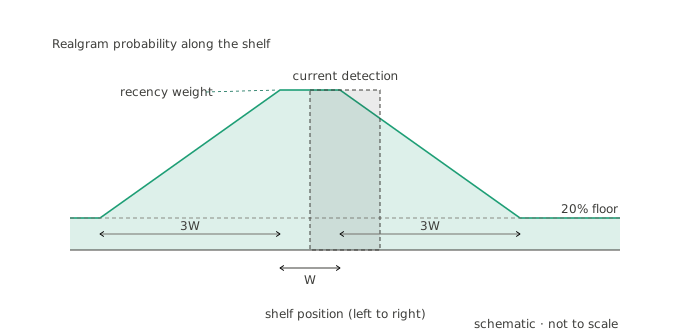
Realgram works along one axis. We model where products sit left to right and treat the vertical as uniform over the shelf height. The unit is the average product width on the shelf: the sum of detection widths over their count. Call it W.
For each product seen in recent labelings, we take its left and right edge. Between them the product’s probability sits at its recency weight. From each edge it spreads outward by three widths, three W, fading down to a floor of around 20%. To score a current detection, we take every labeled zone that overlaps it by at least 30% and average the probability over the overlap. That average is the realgram probability for that candidate at that box.
The recency decay
Recent labelings count more. The weight falls linearly from 100% for a labeling under a day old to around 30% for one a week old. That is about ten points per day, and it holds at that floor. We collect labelings over a 30-day window, so the recent week dominates while older labelings still contribute at the floor. Two time constants live here: a 30-day memory and a one-week decay to the floor.
Combining with the embedder
Realgram does not run alone. It adjusts the embedder’s candidates, and how much depends on how sure the embedder already is. We read the top-1 cosine. If it is at or below around 80%, we trust the model less. We restrict the candidates to realgram products and add a fifth of each one’s realgram probability to its score. If the top-1 is above 80%, we leave the field alone and only nudge the top-5, adding a twentieth of the realgram probability. When a spot has no recent labelings, realgram contributes nothing and the pipeline falls back to the plain embedder.
From v1 to v2
The first version combined three searches: the default search space, a realgram search, and a planogram search, blended by a weighted sum. A product absent from realgram or planogram simply scored zero there. That worked. But the blend weights were one more thing to tune. A distance-decay term we tried on the realgram score did not help on its own. The second version, the one above, reworks how the realgram space is built and applies it through the two confidence branches.
The parameters, and why they became a problem
Realgram is cheap to describe and expensive to tune. Counting the spatial and temporal knobs, the blend weights, and the two confidence additions, it carries around thirteen parameters. A few have sensible defaults, with a tighter preset for noisy shelves:
| Parameter | Default | Tighter |
|---|---|---|
| Confidence threshold | 80% | 85% |
| Spread, in product widths | 3 | 5 |
| Edge probability floor | 20% | 5% |
| Staleness penalty per day | 10% | 5% |
| Add when the model is unsure | 20% | 10% |
| Add when the model is sure | 5% | 0% |
We tuned these by hand and with Optuna. Each new heuristic adds two or three more, and past a dozen Optuna starts to overfit the validation set. That parameter sprawl is what eventually pushed us to replace the hand-tuned blend with a learned ranker. That story is part three.
Where realgram helps, and by how much
Realgram is the step that takes the recognizer from around 85% to around 92%. As everywhere in this series, that is the share of predictions a labeler confirms, so treat it as a proxy that runs a little high. The wins are the near-ties: two SKUs a hundredth apart in cosine, where the embedder cannot see the difference in volume or text.
It is not a free lever. We tried rolling predictions back to the previous realgram labeling on a large validation set. It moved almost nothing: a handful of predictions on bright crops, a few more on dark ones. It even slightly hurt the darker and partial-product slices. When the signal is already weak, leaning harder on it does not help.
Where it fails
Realgram fails in predictable ways. A spot nobody labeled recently is a guess, and the pipeline falls back to the embedder. A layout change leaves a stale prior that points at the product that used to be there. Package end-faces, glare-hit crops, and sparsely labeled items all score low, because the recent history is thin or wrong. And the parameters multiply: every fix adds a few, and the tuning overfits. Those are the limits a learned ranker was built to push past.
Four things we took away
Spatial priors are cheap signal. What sat at a shelf spot last week is strong information the embedder throws away. It is most of the jump from 85% to 92%.
Trust the prior less when the model is sure. A confidence threshold that only nudges high-confidence predictions keeps realgram from overriding a clear read.
Decay matters as much as distance. A one-week decay to a floor, inside a 30-day memory, is what keeps a stale spot from dominating.
Parameters are a cost. Around thirteen knobs is where hand tuning stops scaling and a learned ranker starts to pay off.
The recognizer it sits inside is part one. What replaced its hand-tuned blend is part three. If you are scoping a build like this, the shelf-monitoring use-case is where it becomes a project.