Metabase BI on your own servers, with the setup, modeling, and dashboards done for you
Metabase is free and runs inside your own infrastructure, so the data never leaves your servers and there is no per-seat license to renew. We do the part that takes time: connecting the sources, defining the metrics, and building dashboards your business users can read without help.
Discuss a pilot →Quick facts
- Business size
- Teams that have outgrown spreadsheets and want self-serve reporting without per-seat BI licensing
- Timeline
- First dashboards within the first weeks. Designing the analytical layer takes around 4-6 weeks; after that, ad-hoc questions are answered by the built-in AI in the moment, and building a new curated dashboard takes about 30-60 minutes.
- Budget range
- Metabase itself is free. When a cloud data warehouse is needed, hosting runs from a few hundred euros a month. Setup and modeling are project-based [TBD: confirm engagement range].
- Hardware
- A server you control (your cloud account or on-premise). Metabase connects to your existing databases; no data is copied to a third party.
- Data needed
- Read access to your data sources: production databases, warehouse, ERP, CRM, marketing platforms, or whatever holds the numbers you report on.
- Evolution
-
- Genesis
- Custom-built
- Product
- Commodity
A vendor sells this result ready-made. We set it up and tune it to you.
What this scale means
Further right means more proven and cheaper. Further left means newer and riskier. Here is the test for each step.
- Commodity
- You could get the result yourself from a ready service, with almost no work. We rarely take these on.
- Product
- A vendor already sells this result turnkey, like shelf recognition from Trax or document reading from ABBYY. If one of them fits you, use it. You come to us when it does not: when it has to run on your own servers, cost less, or fit systems the product cannot reach.
- Custom-built
- Vendors sell only the parts. A tool like Tableau hands you charts, but the dashboards and metrics for your business still have to be built. That build is the work, and that is us.
- Genesis
- The approach exists but does not work reliably yet. You are betting on it maturing, so it costs more and carries more risk.
Expected outcomes
The Problem
Most reporting starts in spreadsheets and stays there longer than it should. Each team keeps its own file, the numbers drift apart, and answering a new question means waiting for whoever owns the query. Reporting stays locked to the few people who can write the queries, and business decisions get made on intuition while the data sits unused.
When a company finally decides to fix this with a real BI tool, the next obstacle is cost and control: Tableau and Power BI charge per seat, and the data often has to move into a vendor’s cloud to be useful.
Metabase removes both of those obstacles. It is open-source and free to run, and it installs inside your own infrastructure. The data stays on servers you control, and no license scales with headcount. The catch is that a BI tool is only the visible layer. What makes dashboards trustworthy is the work underneath: connecting the sources, agreeing on what each metric means, and modeling the data so one number carries one meaning on every screen. That is the part we do.
What the Solution Does
We stand up Metabase on your infrastructure and turn it into a working reporting system your team can use on its own.
- Deployment, Metabase installed in your cloud account or on-premise, with access control and backups configured.
- Source connections, your production databases, warehouse, ERP, CRM, and marketing platforms connected as data sources.
- Metric modeling, the definitions that matter (“revenue”, “active user”, “churn”) agreed and codified so every dashboard reads from one shared meaning.
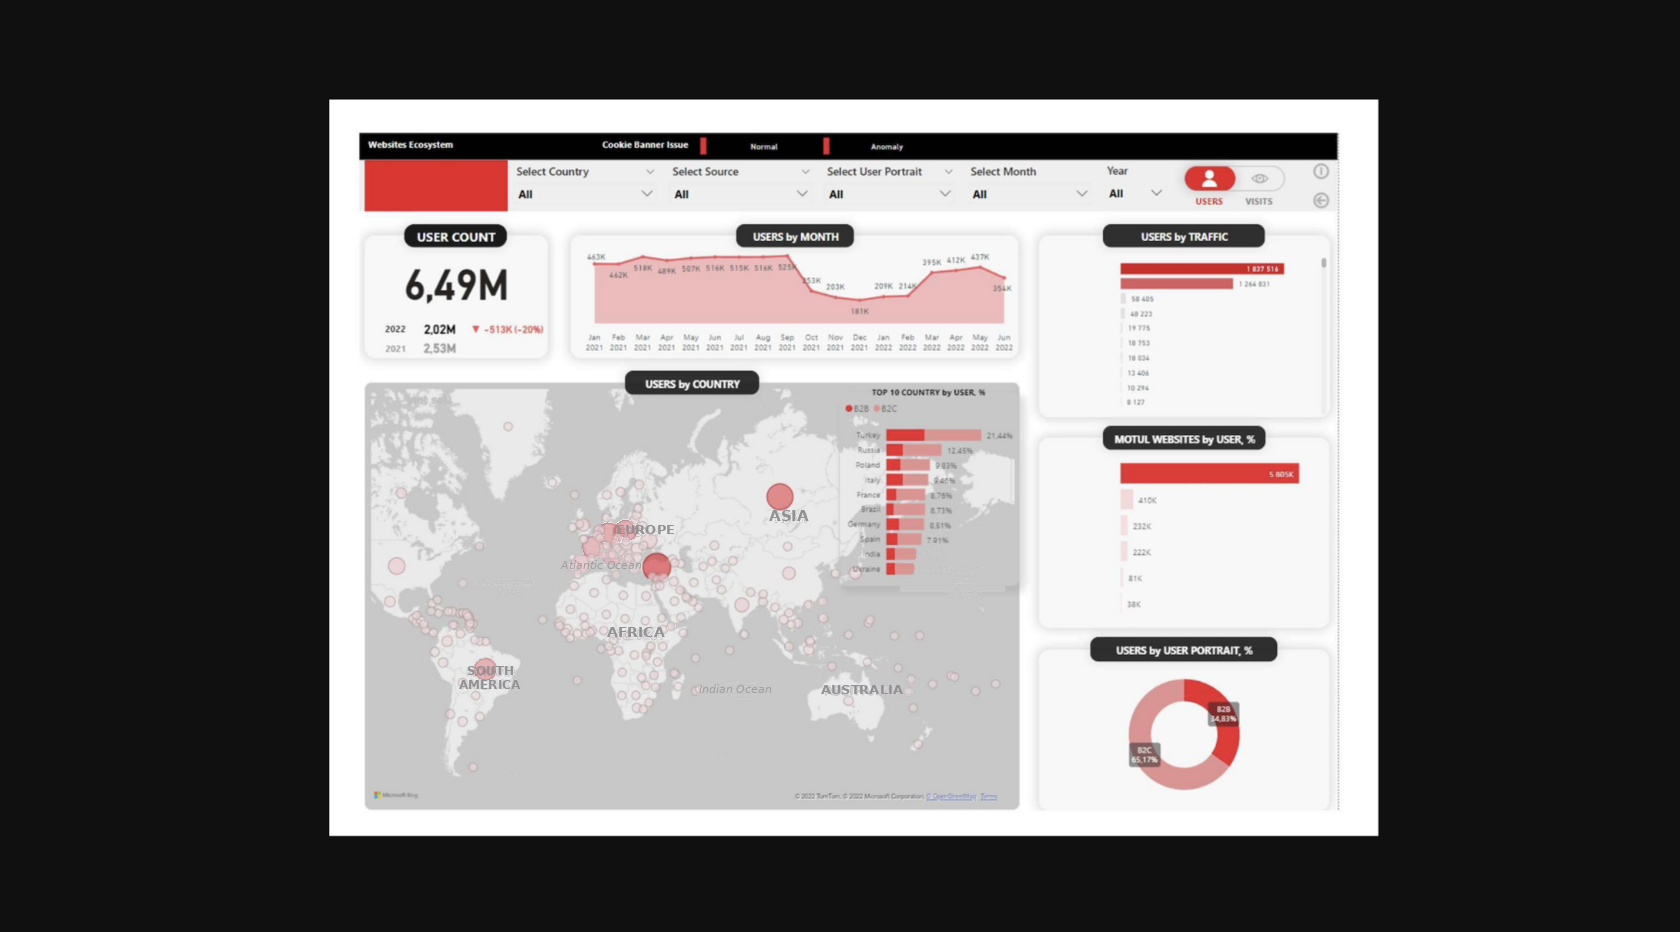
- Dashboards, built for the people who consume them, with a clean executive view and a separate analyst view where deeper exploration is needed.
- Self-serve setup, the visual query builder configured so business users can answer their own questions without writing SQL.
- Handover and training, your team learns to build and edit dashboards, so you are not dependent on us to keep using it.
Where It Fits
This makes sense if you…
- Have outgrown spreadsheets and want reporting the whole team can read
- Want your reporting data to stay on your own servers, for cost, policy, or compliance reasons
- Are paying, or about to pay, per-seat BI licensing and want an open-source path instead
- Have data in databases already, and mainly need it connected, modeled, and made readable
- Want business users to answer routine questions without going through an analyst
This is probably not the right time if you…
- Want a fully managed BI subscription and do not care where the data is hosted, in which case Metabase Cloud or a commercial tool is simpler
- Have no usable data sources yet, where the first job is data collection. A BI tool comes after.
- Need heavy custom data engineering and a warehouse first. That is the executive BI track, a different job from a Metabase setup.
- Have one system that already answers every question on its own
Business Value
No per-seat license. Metabase is open-source. Adding a viewer does not add a bill, so you can give the whole company read access.
Data stays yours. Because Metabase runs on your servers and connects to your databases in place, the numbers do not move into a vendor cloud. For teams with policy or compliance constraints, this is often the deciding factor.
Self-serve answers, on a layer that holds. The query surface is no longer the hard part. Metabase already ships an AI assistant: a business user asks a question in plain language and gets back a chart. On a self-hosted instance it runs on your own model key, so the data stays in your environment. What decides whether the answer is right is the analytical layer underneath. There the data is cleaned and modeled, and each metric is defined once. Metabase ties its own AI to that layer: its paid tiers can restrict the assistant to verified metrics, and its docs note the AI degrades on a messy schema. Building that layer is the work we do. With it in place, the built-in AI answers a new question in the moment. No round-trip through the analyst queue, and the answer can be trusted. Without it, both the dashboards and the AI give confident wrong answers.
One meaning per metric. The real deliverable is agreement on definitions. When “revenue” is codified once, the quarterly review stops opening with an argument about whose number is right.
A tool the team can run. After handover your people build and edit their own dashboards. The system keeps working without a standing dependency on us.
How It Works
1. Deploy Metabase
Metabase is installed in your environment, your cloud account or an on-premise server. We configure user accounts, group-based permissions so each team sees only what it should, scheduled backups, and upgrades.
2. Connect the data sources
Metabase connects directly to the databases you already run, plus your warehouse, ERP, CRM, and marketing platforms where relevant. Reporting reads from the source in place, so there is no separate copy to keep in sync unless your volume calls for a warehouse.
3. Model the metrics
We work through the definitions that drive decisions and write them down: which transaction states count as revenue, how refunds and discounts are handled, what counts as an active user, which time zone a date sits in. These are codified, so every dashboard pulls from one shared definition. Each report stops inventing its own.
4. Build dashboards
Dashboards are built for their readers. The opening view shows the most important numbers on one screen, with drill-down where it helps. We keep the executive view separate from the analyst view, since the two audiences want different depth.
5. Set up self-serve and alerts
Business users explore data two ways: they ask the built-in AI in plain language, or use the visual query builder, much like working in a spreadsheet. A full SQL editor stays available for analysts. Scheduled reports and threshold alerts push the right numbers to email or chat on a cadence.
6. Hand over and train
Your team is trained to build, edit, and maintain dashboards and to manage access. Documentation of the metric definitions and naming conventions is part of the delivery, since that is what keeps the system usable past the first project.
Stack
Metabase for the BI layer; your existing databases as sources; Datapipe for ETL and a warehouse (ClickHouse, BigQuery, Snowflake, or Postgres) when reporting volume justifies one. Many deployments need only Metabase connected to the databases already in place.
What You Need to Make This Work
Data. Read access to the sources that hold your numbers. More history makes for better trend reporting.
Infrastructure. A server you control for Metabase, in your cloud account or on-premise. Hosting cost is modest and scales with usage.
Team. A business owner per reporting area (sales, marketing, operations, finance) to agree on requirements and metric definitions. You also need someone on your side to take ownership at handover.
Implementation Roadmap
1. Setup
Deploy Metabase, connect the priority data sources, configure access. Output: a running Metabase instance reading live data, with the first dashboards in place. Timeline: around 1-2 weeks per data source to replicate and connect.
2. Modeling and rollout
The work runs in order: agree and codify the priority metric definitions, then design the analytical layer and build dashboards for each reporting area. After that, configure self-serve and alerts, document the data, and train the team. Output: a reporting system the business uses on its own, with documented definitions. Timeline: around 4-6 weeks for the analytical layer and first dashboards, plus 1-2 weeks to document and train.
3. Ongoing
New questions become new dashboards. Your team owns day-to-day reporting; we stay available for larger changes such as new sources or a warehouse if volume grows.
Keep in Mind
- A BI tool does not fix data culture. If people do not trust the numbers, prettier dashboards will not change that. Adoption is partly a change-management job.
- Metric definitions are business decisions in technical clothing. “What counts as revenue?” is a policy question. Agreeing on it is real work, and it is where most of the value sits.
- Self-hosting means you own the server. Open-source removes the license. The operational responsibility stays. We set up backups and upgrades, but the infrastructure is yours to keep running, or ours to maintain under an agreement.
- At high volume, you may still want a warehouse. Reporting straight off production databases is fine up to a point. Past it, you need a separate analytical store, which is the executive BI track.
- Power BI and Looker have their place. If your stack is already Microsoft or Google Cloud, a commercial tool can be the better fit. When a managed subscription suits you too, we will say so.
FAQ
Is Metabase really free?
The open-source edition is free to run, with no per-seat license. You pay for the server it runs on and for the setup and modeling work. The built-in AI assistant works on the free self-hosted edition too, as long as you bring your own model key; the managed AI service, usage controls, and gating the assistant to verified metrics are paid features. Metabase also sells paid editions (Pro, Enterprise, and the hosted Metabase Cloud) with extra features; we will tell you if your needs actually require one.
Metabase or Power BI?
Metabase is open-source, self-hosted, and quick for business users to pick up. Power BI integrates tightly with the Microsoft stack and has stronger native data modeling, under per-seat licensing. The right answer depends on your existing stack, your cost profile, and where you want the data to live. We work with both. We have written a fuller comparison in Metabase vs Power BI.
Can the data stay entirely on our servers?
Yes. That is the main reason teams choose self-hosted Metabase. It installs in your infrastructure and queries your databases in place, so reporting data does not move to a third-party cloud.
Do we need a data warehouse?
Not always. Many deployments report straight off existing databases. A warehouse becomes worthwhile when query volume grows or when data has to be unified from many sources, which is the executive BI track.
Can dashboards be embedded in our own apps?
Yes. Metabase supports embedding dashboards in an internal portal or a customer-facing product, with access control on top.
Will our team be able to run it after handover?
That is the goal. We train your people to build and edit dashboards and manage access, and we document the metric definitions. You can keep operations in-house or keep us on for maintenance.
Ready to Discuss?
If your reporting is a pile of spreadsheets, self-hosted Metabase is a practical place to start. It gives you self-serve BI that stays on your own servers. We will look at your data sources and the questions you most need answered, then tell you what a deployment would involve.