Executive dashboards that don't lie, because the data layer underneath is engineered all the way down
We build BI from the warehouse up: data engineering, modeling, dashboards. The result is decisions made on real data, with no more guessing which spreadsheet looked authoritative this morning.
Discuss a pilot →Quick facts
- Business size
- Mid-market and enterprise, companies whose decisions depend on cross-functional data
- Timeline
- 2-4 weeks test, 1-2 months pilot, 2-4 months production
- Budget range
- Pilot from €7-8k. Data infrastructure costs scale with volume.
- Hardware
- Cloud-based data warehouse (ClickHouse / BigQuery / Snowflake / Postgres). BI tool of your choice.
- Data needed
- Source systems: ERP, CRM, marketing platforms, product analytics, finance system. Whatever the business runs on.
- Evolution
-
- Genesis
- Custom-built
- Product
- Commodity
No product gives you this. We assemble and train it around you.
What this scale means
Further right means more proven and cheaper. Further left means newer and riskier. Here is the test for each step.
- Commodity
- You could get the result yourself from a ready service, with almost no work. We rarely take these on.
- Product
- A vendor already sells this result turnkey, like shelf recognition from Trax or document reading from ABBYY. If one of them fits you, use it. You come to us when it does not: when it has to run on your own servers, cost less, or fit systems the product cannot reach.
- Custom-built
- Vendors sell only the parts. A tool like Tableau hands you charts, but the dashboards and metrics for your business still have to be built. That build is the work, and that is us.
- Genesis
- The approach exists but does not work reliably yet. You are betting on it maturing, so it costs more and carries more risk.
Expected outcomes
The Problem
In most mid-market and enterprise organizations, executive analytics still runs on spreadsheets, now with an AI assistant alongside. An analyst pulls an export into Excel, asks Claude or ChatGPT to crunch it, and pastes the answer into the deck. It is faster than it used to be. The numbers still disagree. Each team starts from its own export, so every quarterly review opens with one argument: whose figure is right.
The underlying problem is data engineering, and an AI assistant on top does not fix it: point it at ad-hoc exports and it answers from those disagreeing numbers, only quicker. Source systems (ERP, CRM, marketing platforms, product analytics, finance) all hold pieces of the truth. The fix is a proper data warehouse: one engineered store the whole company reports from. Without it, every report becomes a one-off extraction. Every metric definition becomes negotiable. Every analyst on the team becomes a query-on-demand service for executive ad-hoc requests.
The conventional “fix” is to buy a BI tool (PowerBI, Tableau, Looker) and hope. The BI tool turns out to be the easy part. What is missing is the warehouse, the data modeling, the metric definitions, and the engineering discipline that makes a dashboard trustworthy.
We have written about this pattern at length: “Why is your analytical department slow?”, “Why analytical dashboards fail to drive decisions”, and “Metabase vs Power BI”. The diagnosis is consistent: organizations buy dashboards before they engineer the data layer.
What the Solution Does
A full-stack BI deployment: warehouse, data modeling, and dashboards. Executive teams get one source of truth.
- Source data ingestion, pull from ERP, CRM, ad platforms, product analytics, finance, custom databases.
- Data modeling, design the warehouse schema based on what questions executives actually ask. We use Minimal Modeling by default, explicit anchors, attributes, and links.
- ETL pipeline, the plumbing that pulls data in, cleans it, and loads it ready to query (ETL). We run Datapipe for incremental, dependency-tracked data transformations.
- Metric definitions, codified in the warehouse so “revenue” carries one meaning everywhere.
- Dashboards, Metabase, PowerBI, Looker, Tableau, your choice. We build them tuned for executive use, with the analyst view kept separate.
- Iterative improvement, new questions become new dashboards; old metrics get refined.
Where It Fits
This makes sense if you…
- Are mid-market or enterprise with multiple source systems
- See real cost from “what’s the real number?” debates in leadership meetings
- Have an analyst / data team that’s currently a bottleneck for cross-functional questions
- Want infrastructure that scales as the business grows, with no more point solutions to replace later
- Are ready to invest in data engineering, where the dashboards are only the visible layer
This is probably not the right time if you…
- Run a single-system business where one ERP / CRM has all the data already (the cost of unification exceeds the benefit)
- Don’t have executive buy-in for “the warehouse is the source of truth” as a policy
- Have no analytics resources to maintain the deployment going forward
- Are looking for a one-off dashboard, where strategic data infrastructure would be overkill
Business Value
Trust in the numbers. When executives can drill into a metric and trace it back to source records, debates about “is this right?” disappear. The conversations shift to “what should we do given this data?”, which is the conversation that creates value.
Analyst time recovery. Analyst teams spend most of their time on one-off ad-hoc requests. A well-designed BI layer absorbs those automatically. Typical reduction in analyst firefighting: 40-70%, depending on how ad-hoc the team was before.
Decision speed. Picture a cross-functional question: “how is the new product doing for our top-tier segment?” It used to mean “let me schedule a meeting”. Now it means “let me check the dashboard”. That speed compounds at the leadership level.
Onboarding for new leadership. New executives get a coherent picture of the business in days, where it used to take months. The dashboards are the orientation material.
One source of truth, repeatedly. This is the value executives care about most after the initial deployment. Every metric, every dimension, every cohort, defined once, consistent everywhere.
How It Works
The architecture is data-engineering-first. Dashboards come last.
1. Source ingestion
Datapipe connects to source systems via API, DB connections, or file drops. Incremental processing, only changed data flows through. Dependency tracking, when an upstream schema changes, downstream transformations get flagged.
2. Warehouse design
We design the warehouse using Minimal Modeling, explicit anchors (entities like customer, order, product), attributes (properties of those entities), and links (relationships between them). The result is a warehouse that’s easy to query, easy to extend, and consistent across business domains.
For high-volume analytics, we typically use ClickHouse, a fast, low-cost database for reporting at scale. We have written about tuning it for fast processing. BigQuery, Snowflake, or Postgres are also fine choices, depending on team preference and cost profile.
3. Metric definitions
The most important deliverable. “Revenue” gets defined explicitly: which transaction states count, how refunds are treated, how discounts are subtracted, what time zone the date is in. Codified in the warehouse so every dashboard pulls from one shared definition.
4. ETL / transformation layer
Data flows through staged transformations: raw, then cleaned, then modeled, then aggregated. Datapipe handles the orchestration with incremental processing, so when a row changes upstream, only the affected downstream aggregates recompute.
5. Dashboards
Built for executive use. The opening view is one screen with the most-important numbers; drill-down available where it’s needed. We typically use Metabase by default (open-source, fast-to-deploy, marketing-friendly UX). PowerBI / Looker / Tableau as alternatives.
We’ve written a Metabase vs Power BI comparison; the choice depends on existing infrastructure, cost profile, and how technical the dashboard consumers are.
6. Documentation and naming
Every metric, every dimension, every cohort gets documented. Naming follows a defined convention. We have written about how to name and document analytics events. The documentation is not optional: it is what makes the warehouse usable beyond the first project.
Stack
The stack, by layer: Datapipe for ETL; ClickHouse / BigQuery / Snowflake / Postgres for the warehouse; Metabase / PowerBI / Looker / Tableau for dashboards; Python for transforms; Grist for editable structured data; Minimal Modeling for the schema design.
What You Need to Make This Work
Data. Read access to your source systems. Historical data where available, since more history leads to better analytics.
Integrations. Source-system APIs / DB connections. Outbound: your BI tool consumes from the warehouse.
Hardware. Cloud-based. Warehouse hosting scales with volume.
Team. A business stakeholder per major domain (sales, marketing, ops, finance) for defining requirements. A data engineer for the integration (around 60-100 hours during pilot). Analytics consumers willing to provide feedback on dashboards.
Implementation Roadmap
1. Test (2-4 weeks)
Identify priority business questions. Connect priority source systems. Build the initial warehouse schema. Deliver the first 3-5 dashboards. Output: working BI deployment for the priority questions, with documented metric definitions and recommendations for pilot.
2. Pilot (1-2 months)
Expand to all source systems. Build comprehensive dashboards for cross-functional teams. Define all priority metrics. Train executive consumers. Output: production-grade BI infrastructure, with documented business impact.
3. Production (2-4 months)
Continuous evolution. New questions, new dashboards. Quarterly metric review. Your team owns dashboards and definitions; we stay on for engineering maintenance and major schema evolutions.
Keep in Mind
Where it breaks, and what to plan for:
- Dashboards alone do not fix data culture. Numbers people do not trust still do not get used. Adoption is a change-management challenge as much as a technical one.
- Metric definitions are political. “What counts as revenue?” “What’s the right churn definition?” These are business decisions that happen to look technical. Defining them is real work.
- Data engineering takes time. The warehouse is a substantial investment. Trying to short-cut it produces fragile dashboards that break the first time someone asks a new question.
- BI tool choice matters less than warehouse quality. A great warehouse with a mediocre BI tool produces good outcomes. A mediocre warehouse with a great BI tool produces broken dashboards.
- The work continues past handover. New questions arise weekly. Source systems change. The business model evolves. Plan for ongoing data engineering, since one-time consulting will not hold.
- Plain-English questions only work on a governed semantic layer. Every team now wants to ask the data a question in words and let an LLM answer. Pointed at raw tables it still fails: published benchmarks put accuracy around 40%, because the model invents joins and aggregations. Grounded on a curated semantic layer (a written-down map of your metrics) with codified definitions, that accuracy rises to roughly 85-95%. The layer is exactly what this engagement builds, so plain-English access becomes something you can put in front of executives. We still curate which views it can touch.
FAQ
Why ClickHouse?
We use ClickHouse when query speed and cost matter at high volume. It is an OLAP database, built for fast reporting over large data, the kind of aggregate question a dashboard asks. It is typically 10-100x faster than Postgres at scale, and much cheaper than BigQuery or Snowflake at sustained workload. We have written about ClickHouse tuning specifically.
Why Metabase over PowerBI?
We’ve written about this. Metabase is open-source, easy to deploy, marketing-team-friendly. PowerBI integrates better with the Microsoft stack and has stronger native data-modeling. Choice depends on your stack and team. We work with both.
What about embedded analytics / customer-facing dashboards?
Yes. One warehouse, a different consumer surface. We have shipped both internal and customer-facing dashboards from one underlying infrastructure.
How does this compare to “modern data stack” tools (dbt, Fivetran, etc.)?
Commercial modern-data-stack tools are excellent for organizations that want a managed solution. Our approach (Datapipe and custom transforms) fits when you need one of these: more customization, fully on-prem deployment, substantially lower cost at scale, or integration with non-standard data sources.
Can the BI be embedded in our product?
Yes. Customer-facing embedded analytics is a common deployment pattern. We use one warehouse, with a different dashboard surface and access control.
What about asking the warehouse a question in plain English?
Everyone wants this now, and it works when it sits on a governed semantic layer. Pointed at raw warehouse tables, large language models produce plausible but wrong SQL, with published benchmarks putting raw-table accuracy near 40%. Grounded on curated metrics and a documented model (the layer this engagement produces), that accuracy reaches roughly 85-95%. So the order that works is warehouse and metric definitions first, then plain-English querying as a dependable surface on top, scoped to curated views. It complements the dashboards. It does not replace them.
Ready to Discuss?
If your executive analytics is currently a “whose spreadsheet is right” exercise, this is a strategic investment. It pays back over years, with returns that compound past the first quarter. We will walk through your source systems, your priority questions, and your decision cadence. Then we will tell you what to expect from a deployment.
Case studies
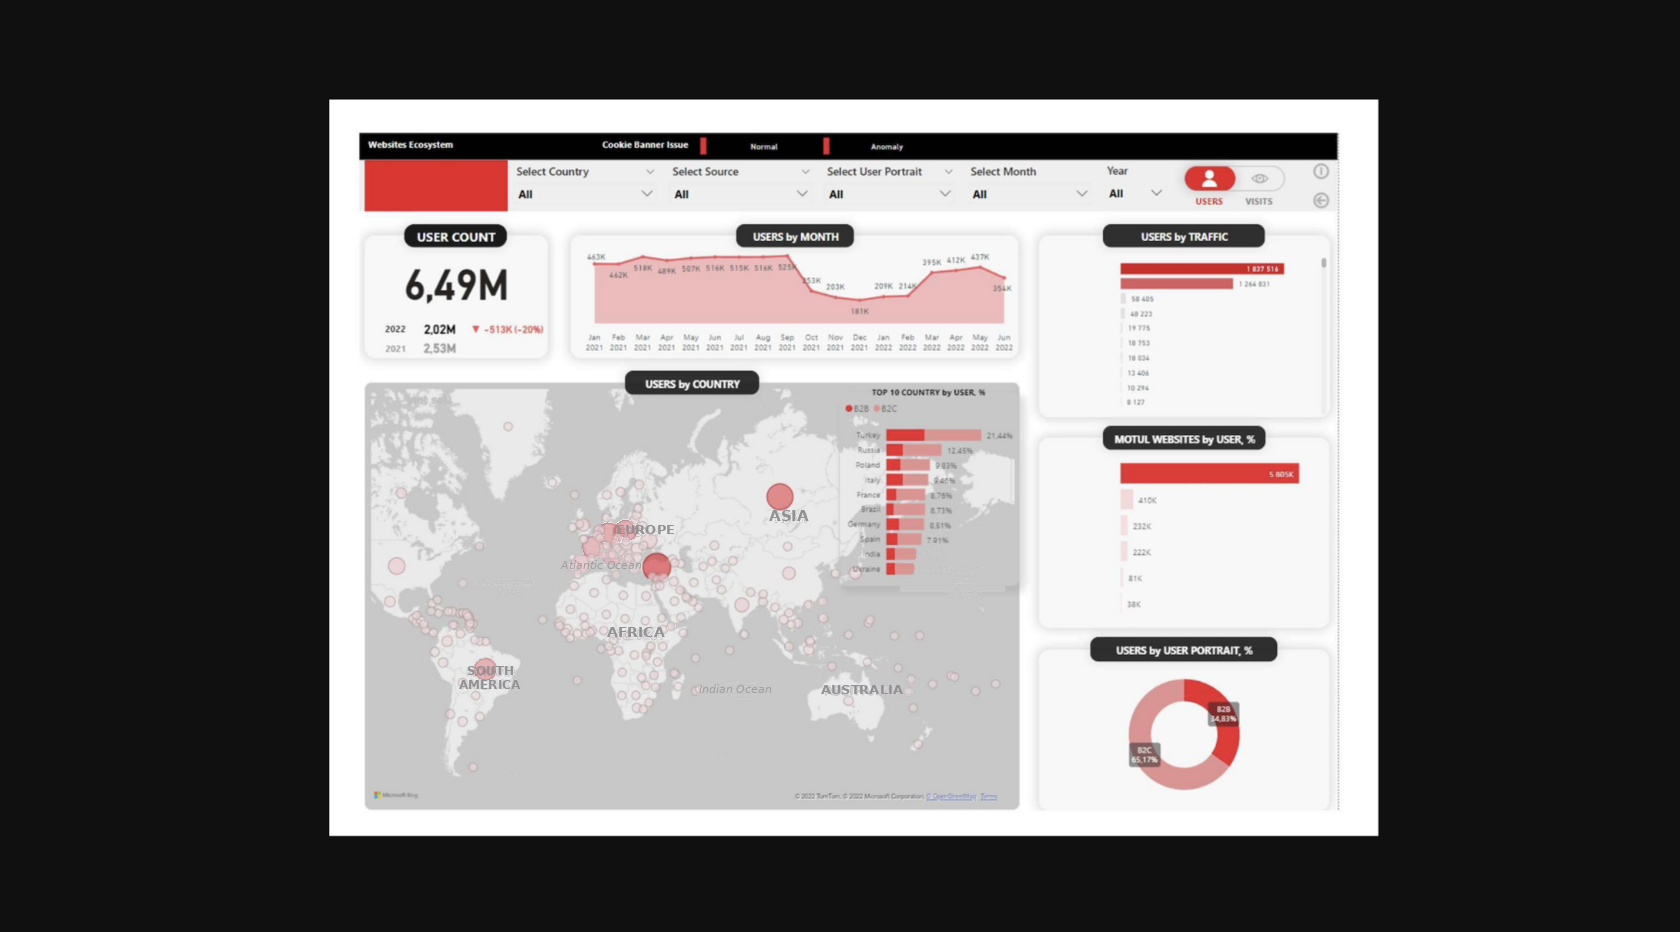
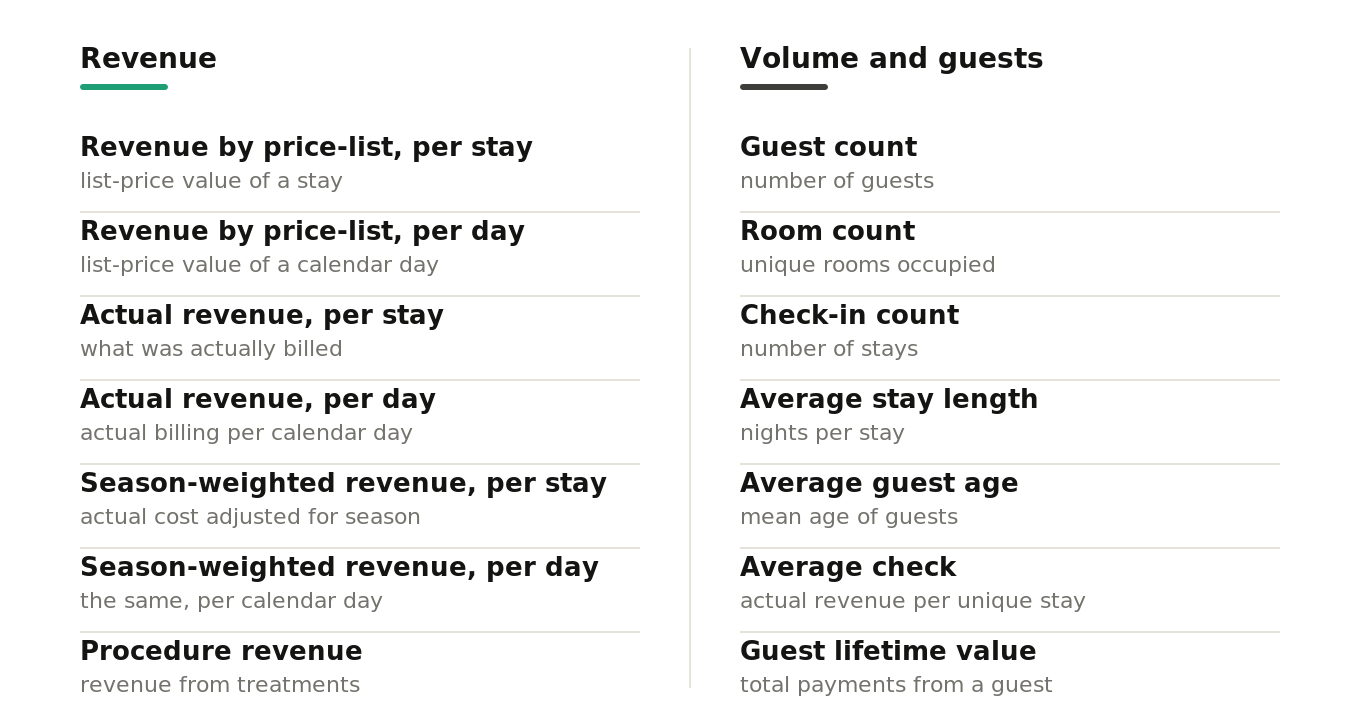
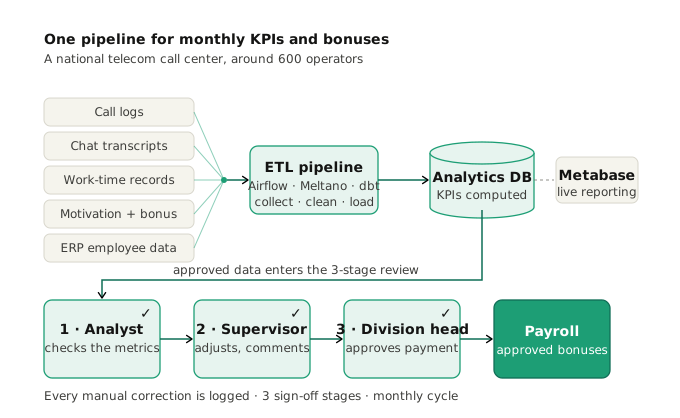
 Motul analytics platform 8 Reporting domains 20+ Data sources Analytics & Data health-resort operator Health-resort analytics 14 Governed metrics 6 BI dashboards Analytics & Data National telecom call center Call-center KPI automation ~600 operators scored 3 approval stages Analytics & Data