
Make your event stream measurable
Raw events land in storage by the hundreds of millions a day. We turn them into pre-aggregated BI tables that feed dashboards and self-service reporting, so product, ops, and finance all measure from one shared source.
Discuss a pilot →Quick facts
- Business size
- Products generating millions to hundreds of millions of events a day across app usage and API traffic.
- Timeline
- 3-5 weeks test, 2-3 months pilot, ongoing build
- Budget range
- Pilot from EUR 25k for a first set of BI tables on one event source. Scales with the number of models and sources.
- Hardware
- No special hardware. Runs on your cloud data stack (object storage, a query engine, a warehouse or lakehouse).
- Data needed
- Raw event records in object storage or a stream, and a short list of the questions the business most wants answered.
- Evolution
-
- Genesis
- Custom-built
- Product
- Commodity
No product gives you this. We assemble and train it around you.
What this scale means
Further right means more proven and cheaper. Further left means newer and riskier. Here is the test for each step.
- Commodity
- You could get the result yourself from a ready service, with almost no work. We rarely take these on.
- Product
- A vendor already sells this result turnkey, like shelf recognition from Trax or document reading from ABBYY. If one of them fits you, use it. You come to us when it does not: when it has to run on your own servers, cost less, or fit systems the product cannot reach.
- Custom-built
- Vendors sell only the parts. A tool like Tableau hands you charts, but the dashboards and metrics for your business still have to be built. That build is the work, and that is us.
- Genesis
- The approach exists but does not work reliably yet. You are betting on it maturing, so it costs more and carries more risk.
Expected outcomes
The Problem
Many products generate events long before anyone can measure them. Every transaction, request, view, or interaction gets logged as a raw record, and the records pile up in object storage by the millions or hundreds of millions a day. The data is all there. What is missing is any structured way to ask questions of it.
Product analytics tools like Mixpanel or Amplitude cover part of the picture, but they have limits. They cost more as volume grows. They are built around app usage, so backend and API traffic fall outside them. And privacy or contract terms often keep whole segments out of them. The result is a familiar gap: the business wants to know how usage is trending, which customers are growing, and where the load comes from. Nobody can tell, because the only thing measured is what reached the register or the billing system.
The raw volume itself is the second problem. Naive queries over a full day of events are slow and expensive, and the jobs that build summary tables fall over with out-of-memory failures or take so long they are never trusted. Without a deliberate pipeline, event data stays write-only.
What the Solution Does
A data layer that turns raw events into clean, pre-aggregated tables the whole business can query. The shape is consistent across deployments:
- Expose the raw data, raw event files in object storage become external tables a query engine can read, with no upfront copy or reformat.
- Flatten and stage, a staging layer parses the raw JSON or log format into typed columns.
- Build entities, an intermediate layer assembles the core objects the business reasons about, such as users, accounts, sessions, or transactions.
- Pre-aggregate, a BI layer builds fact and dimension tables at the grain reporting needs, so dashboards read small tables and never scan raw events.
- Serve, the BI tables feed dashboards and self-service tools, and increasingly an assistant that answers questions and posts digests over those tables.
The point is one shared set of trusted tables. Each team stops writing its own one-off queries differently.
Where It Fits
This makes sense if you…
- Generate large volumes of events that already land in object storage or a stream
- Have segments product analytics tools cannot see, such as API or B2B traffic, or privacy-limited data
- Find that summary jobs are slow, fragile, or never trusted at full volume
- Want product, operations, and finance to share one set of numbers
- Are ready to let business users self-serve once the tables exist
This is probably not the right time if you…
- Have event volumes small enough that a product analytics tool covers everything
- Have no clear questions the business wants answered yet, the tables follow the questions
- Cannot get access to the raw event data or its storage
- Need real-time per-event reactions, which is a different system from analytics
Business Value
One source of truth. Pre-aggregated fact and dimension tables give every team one shared set of definitions. Reporting that used to be scattered across ad hoc queries becomes a shared BI layer, which removes the arguments about whose number is right.
Measuring what was invisible. A deliberate pipeline can include segments that product analytics tools leave out, such as B2B API usage or other privacy-limited traffic. For some products this is the only place where backend and frontend activity are measured together.
Stable refreshes at volume. Because event data is append-shaped, most heavy models can run incrementally, processing only new records. This fixes the slow refreshes and out-of-memory failures that raw volume causes and makes the numbers trustworthy enough to act on.
Faster answers. Once the ready tables exist, business users answer new questions themselves, increasingly with an assistant over the tables. The work no longer queues up behind data engineering.
How It Works
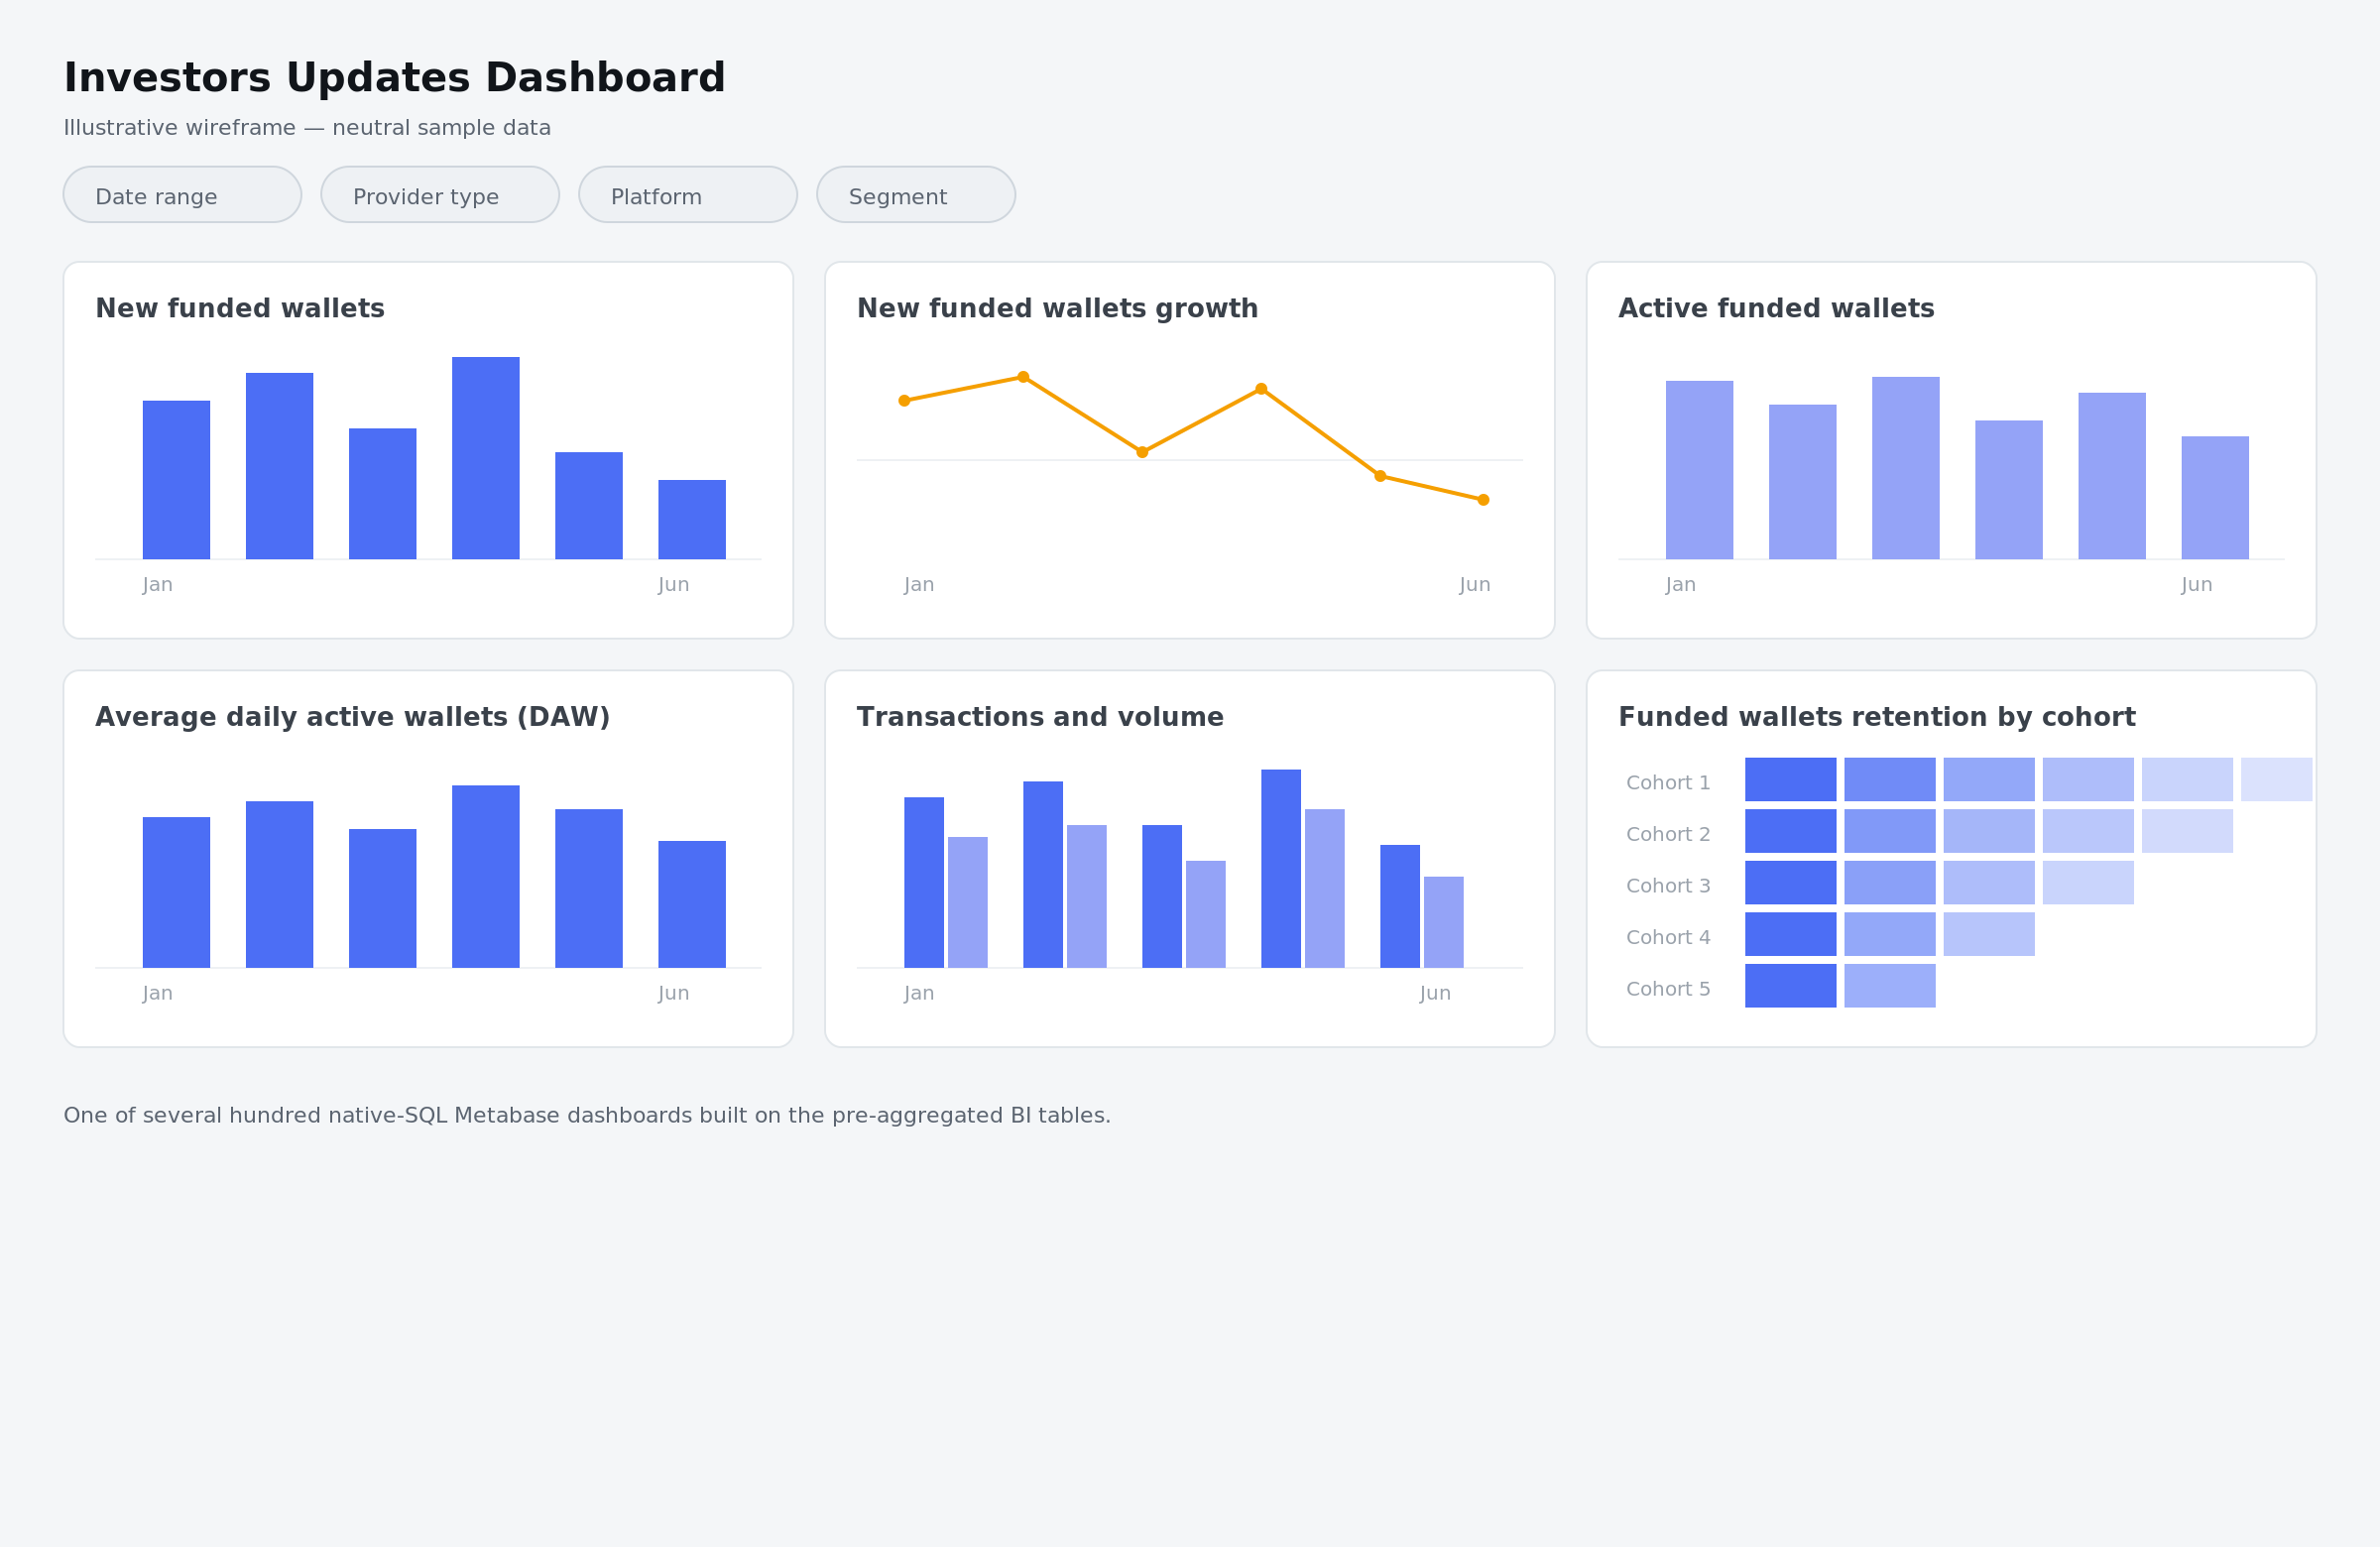
The pipeline below is the pattern we built for the Zerion wallet analytics deployment, where up to around 100 million wallet events a day flow from object storage into BI tables that feed hundreds of dashboards.
1. Raw events in object storage
Events land as raw files, typically JSON, in object storage such as Amazon S3. Each file is a full record of what was requested and returned. We read this in place, with no upfront copy.
2. External tables over the raw data
A query engine such as AWS Athena exposes the raw files as external tables. This means the pipeline can query terabytes of raw events with standard SQL and without a separate load step.
3. Staging layer
A dbt staging layer parses and flattens the raw structure into typed, queryable columns. This is where messy nested JSON becomes clean tabular data.
4. Entity layer
An intermediate layer builds the core entities the business reasons about, such as wallets, users, accounts, or transactions. This is where raw events become the objects people actually ask questions about.
5. BI layer
A final layer pre-aggregates fact and dimension tables at the grain reporting needs. Because the data is event-shaped, the heavy models run incrementally, which keeps refreshes fast and stable at full volume.
6. Serving and orchestration
An orchestrator such as Prefect schedules the runs. The BI tables feed dashboards in a tool like Metabase, self-service querying, and an assistant that can answer questions and post digests to chat. Nobody has to check dashboards by hand.
Stack
Object storage (Amazon S3), a query engine over raw data (AWS Athena), dbt for the layered transforms, Prefect for orchestration, an extract-load tool such as Meltano where sources need pulling, Metabase or a comparable BI tool for dashboards, and an assistant layer over the ready tables.
What You Need to Make This Work
Data. Access to the raw event records and their storage. A short list of the questions the business most wants answered, which sets the grain of the BI tables.
Integrations. Read access to object storage or the stream. A BI tool of your choice. Optionally a chat platform for digests and an assistant over the tables.
Hardware. None specific. The pipeline runs on your cloud data stack.
Team. A data or analytics lead who knows the questions worth answering. An engineering contact for storage and access. Business users who will consume the tables once they exist.
Implementation Roadmap
1. Test (3-5 weeks)
One event source. Stand up external tables over the raw data, build a first staging and BI layer, and validate a handful of metrics against whatever ground truth exists. Output: a working slice of the pipeline and a clear writeup of data quality and volume issues found.
2. Pilot (2-3 months)
Expand to the priority entities and metrics, build the dashboards the consuming team needs, and convert the heavy models to incremental refresh. Output: trusted BI tables in active use, dashboards consolidating reporting that was previously scattered.
3. Build (ongoing)
Add sources, entities, and metrics as the questions grow. Layer self-service and an assistant over the tables. Your team owns day-to-day analytics; we stay on for new models and edge cases.
Keep in Mind
Where it breaks, and what to plan for:
- The tables follow the questions. A BI layer is only as useful as the metrics it is built for. Vague requirements produce vague tables. We start from the questions the business actually wants answered.
- Data quality surfaces fast. Raw events often carry gaps, schema drift, and surprises. The pipeline makes these visible, which is good. It also means early effort goes into cleaning, with modeling waiting behind it.
- This is analytics, and not real-time control. The pipeline measures and reports. If you need to react to individual events in milliseconds, that is a separate streaming system.
- Incremental models need care. Incremental refresh is what makes high volume affordable, and it adds logic for late-arriving and corrected data. We build this in from the start, so nobody bolts it on later.
- Self-service needs trusted tables first. Letting business users and assistants query freely only works once the underlying tables are clean and well-defined. The order matters.
FAQ
Do you copy our raw events somewhere first?
Usually not. A query engine such as Athena reads the raw files in object storage in place, so there is no upfront copy or reformat step before the pipeline can query them.
Can this measure API or backend traffic, beyond app usage?
Yes. That is often the main reason to build it. Product analytics tools focus on app usage and frequently exclude API or B2B traffic, so a custom pipeline is the only place those segments get measured.
How do you keep it fast at hundreds of millions of events a day?
Most heavy models run incrementally, processing only new records and leaving history untouched. This is what fixes slow refreshes and out-of-memory failures at high volume.
Can business users query the tables themselves?
Yes, once the BI tables are clean and well-defined. We increasingly add an assistant over the tables so people can ask questions in plain language and get digests posted to chat.
What BI tool does this work with?
The BI layer is just tables in your warehouse or lakehouse, so it works with Metabase, PowerBI, Looker, and similar tools. The Zerion deployment uses Metabase.
Ready to Discuss?
If your product generates events nobody can measure, and reporting is scattered or missing, this is a fast pilot. We will look at where your raw events land, the questions you most want answered, and tell you what a first set of BI tables would take.

Part of: Analytics & Data ↗