From Web Analytics to a Multi-Domain Analytics Platform for Motul

What started as web-analytics dashboards grew into one warehouse feeding eight reporting areas for Motul, from website behavior to e-commerce, field sales, CRM, and learning.
Where the data comes from
Sources we pull
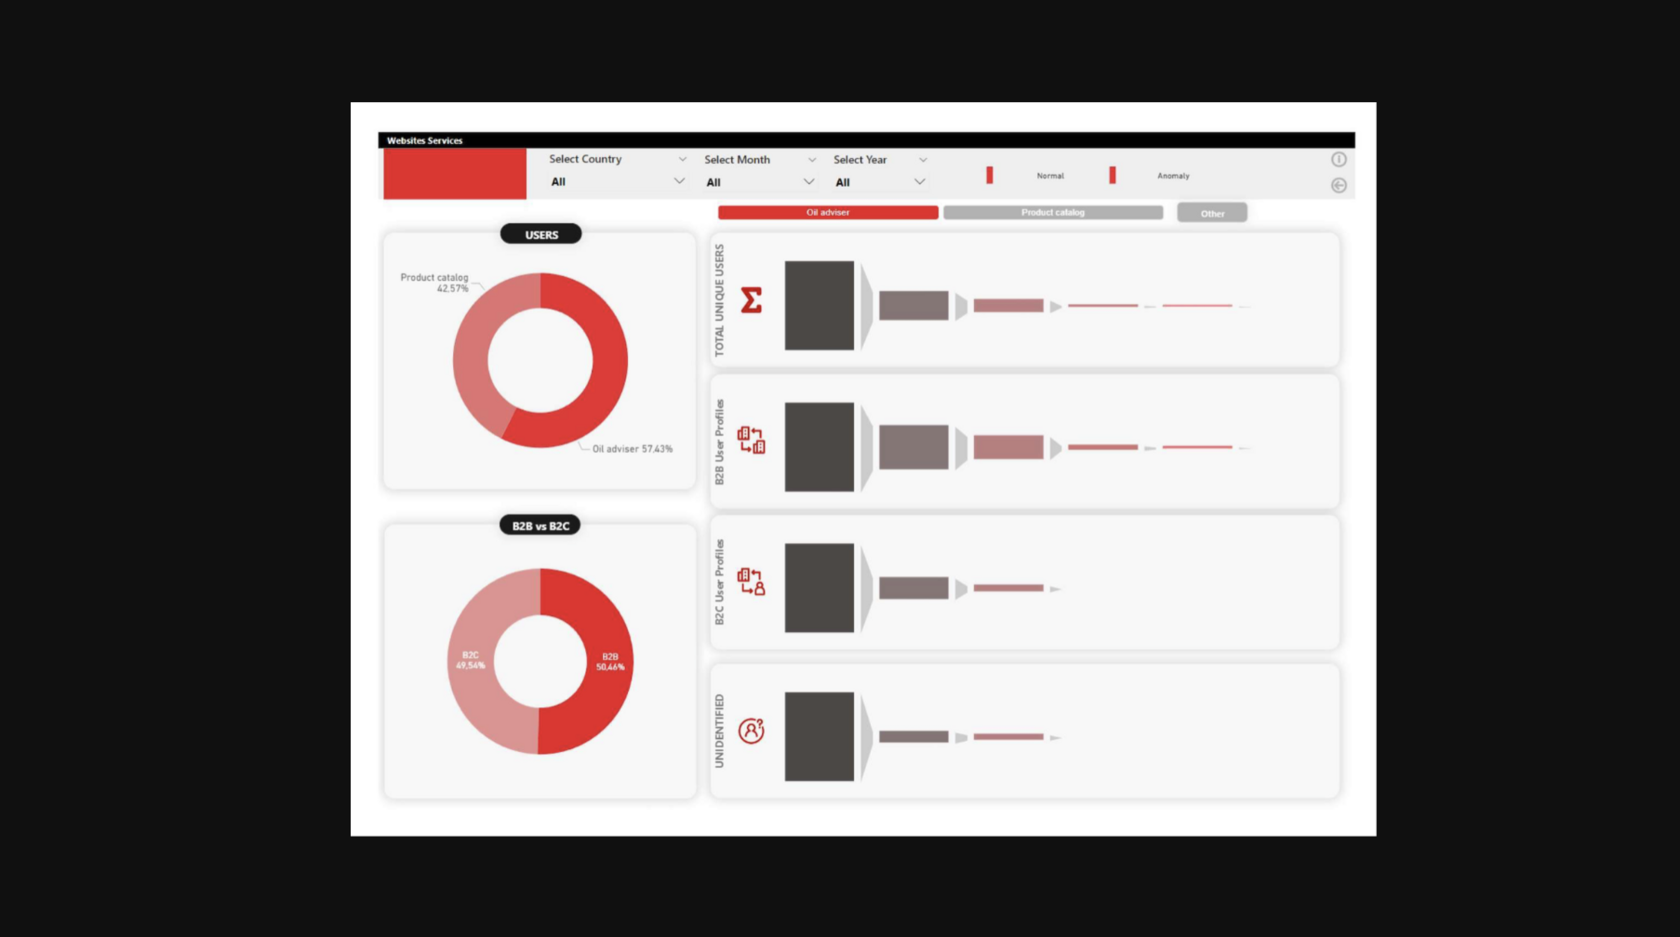
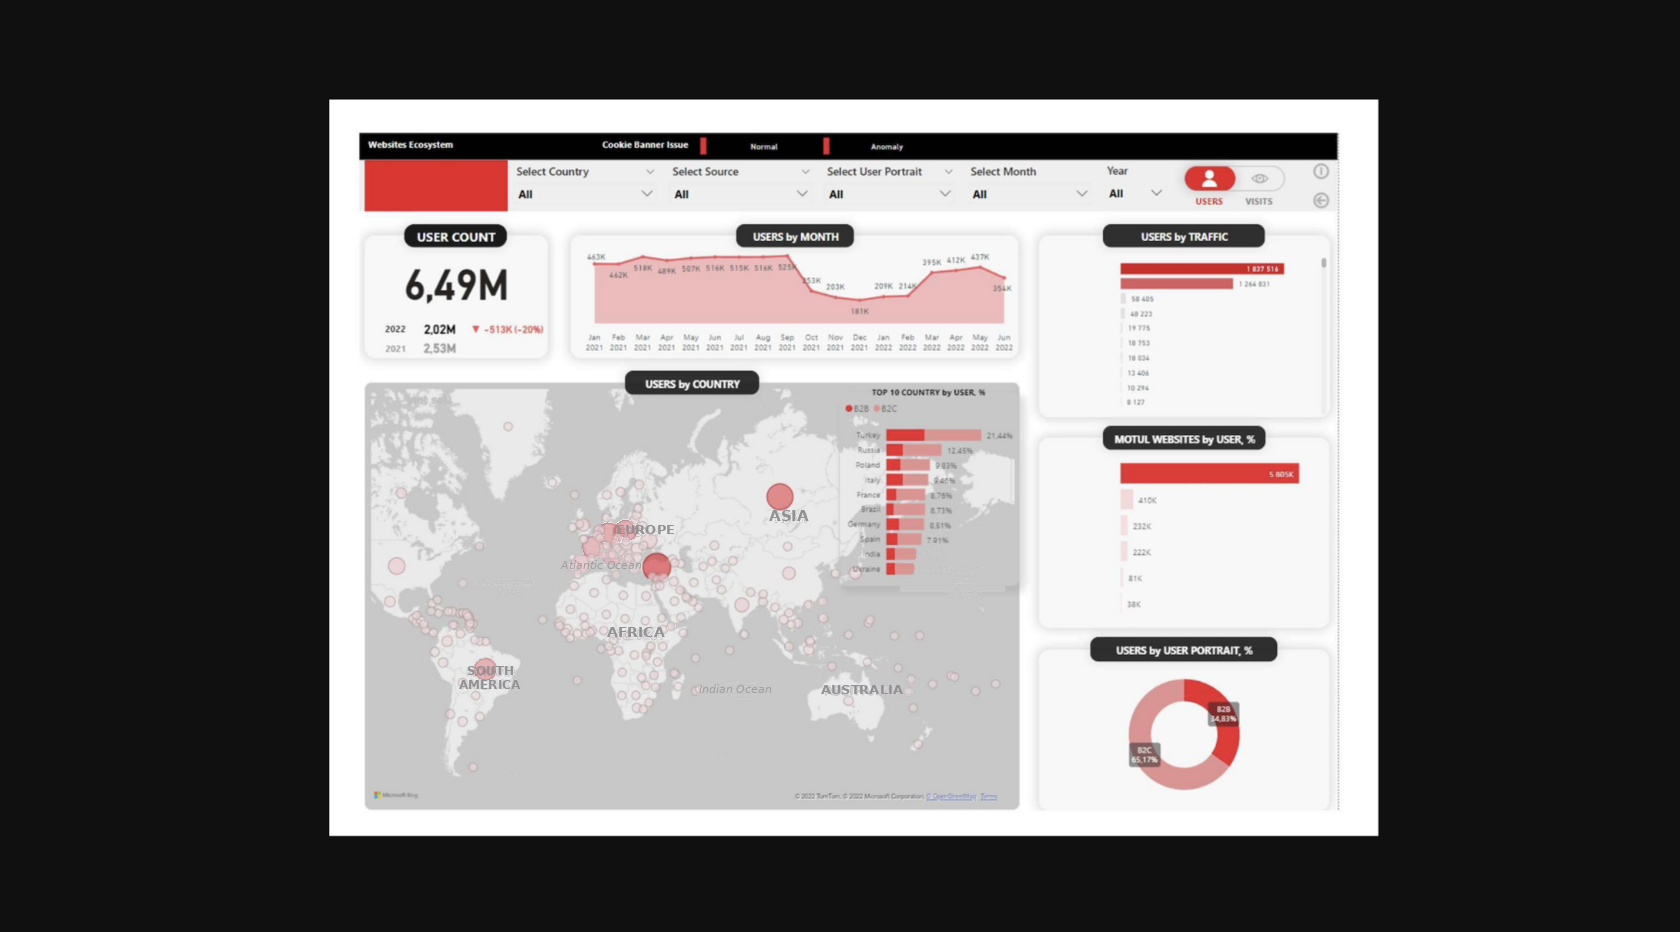
Motul runs one main website, motul.com, plus many smaller satellite sites that help customers pick the right oil for their car, find a reseller, or read about a product. At the start the marketing team spent a lot of time manually pulling traffic and performance numbers together and tracking the brand's activity on social media. They wanted clear top-level numbers for management, tools to understand how people behave on the sites, a view of how visitors move toward buying key products, and a read on which products are popular in which country.
That first need never stopped growing. Over three years the same warehouse took on social media, e-commerce across several marketplaces, the B2B site, PowerSport field events, the CRM, the product catalog, and the learning platform. Each new area arrived with its own messy feed: weekly emailed Excel files, SFTP drops, and manual exports with mismatched SKUs, currencies, and segment names that all had to be cleaned before they lined up.
What we do with it
The data layer
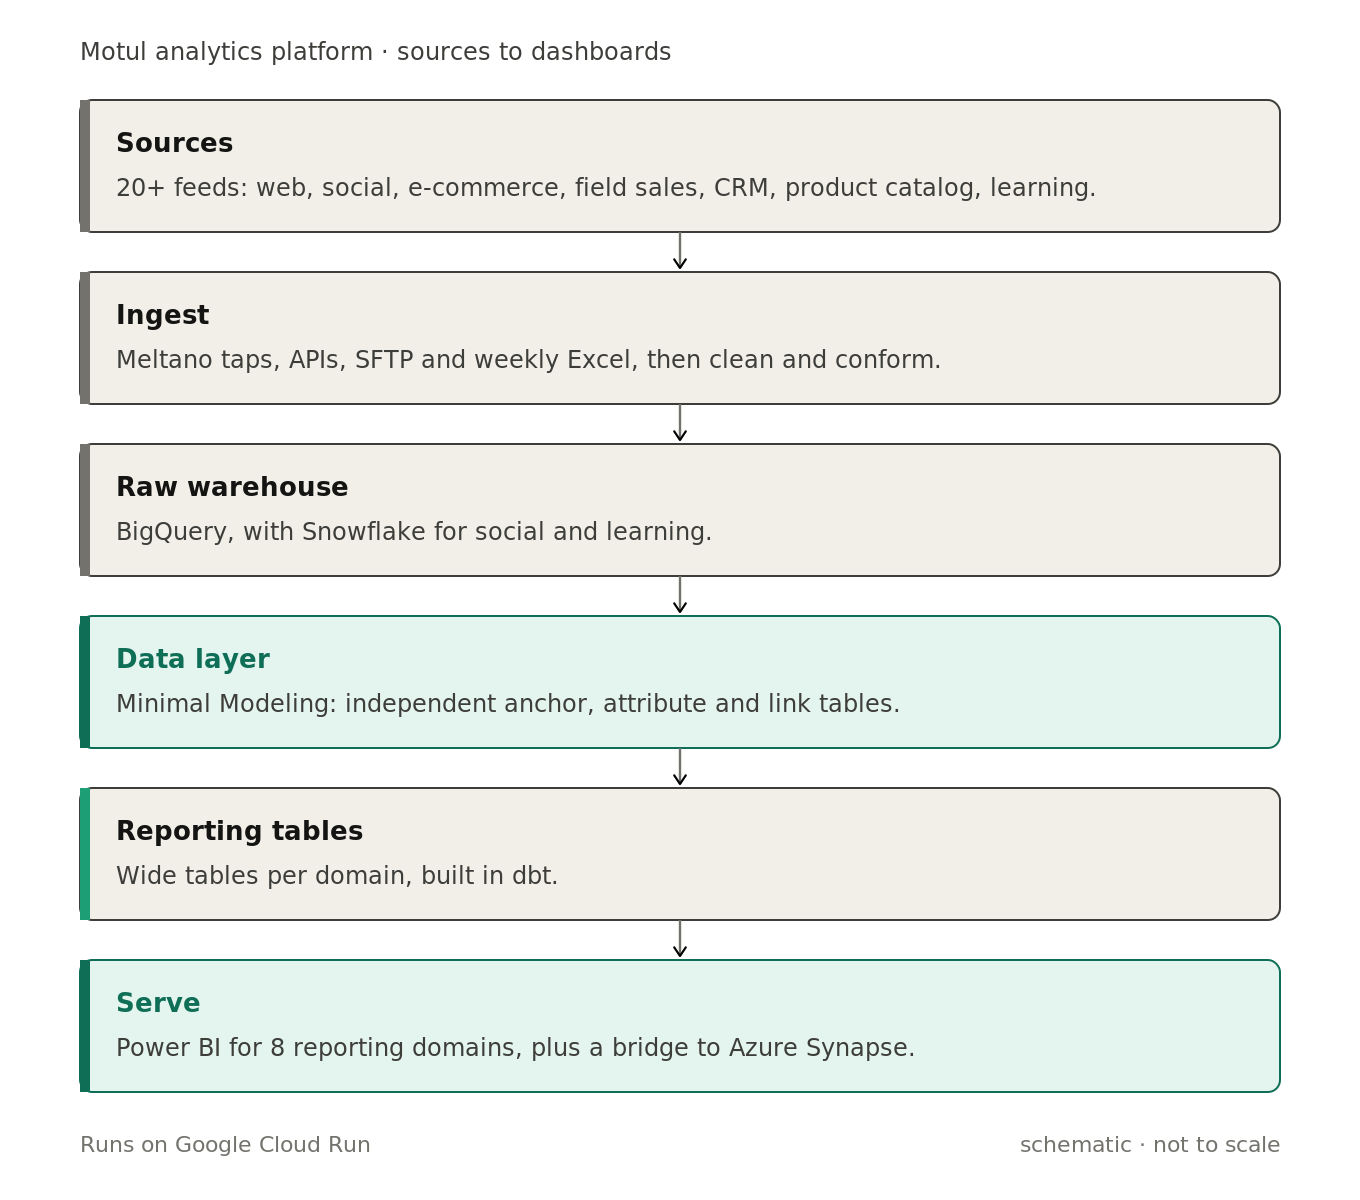
Web data comes from Google Analytics 4 and the older Universal Analytics, the Motul product API, Hotjar, Google Search Console, and the cookie-consent feed. Social activity comes from Hookit. E-commerce comes from Profitero digital-shelf and price monitoring, ChannelSight clicks and sales, Amazon Vendor through the SP-API, Takealot, and MercadoLibre through AlephCRM. Field sales come from PowerSport popup events, with weather joined in to help explain turnout. The CRM comes from AppInsights, product content from the catalog, and learning data from Docebo on Snowflake. All told, more than twenty sources.
Every business concept, such as a product, a category, a visit, or an order, is written down once and built as its own small independent table using Minimal Modeling. We call this shared set of tables the data layer. Wide reporting tables sit on top of it, so fixing or improving a number in one place updates every dashboard that uses it. Orchestration moved from Singer scripts to dbt on scheduled runs.
The pipeline runs on Google Cloud under Cloud Run. A BigQuery-to-Synapse bridge feeds the finished data marts into the client's own Azure and Power BI estate, and an LLM step translates, segments, and summarizes product reviews from the website, the B2B site, and Amazon.
- 01 Ingest 20+ sources through Meltano taps, APIs, SFTP, and weekly Excel files
- 02 Land raw data in one BigQuery warehouse, with Snowflake for social and learning
- 03 Clean and conform messy feeds, reconciling SKUs, currencies, and segments
- 04 Model each business concept as an independent table with Minimal Modeling, forming the data layer
- 05 Build wide reporting tables per domain in dbt
- 06 Serve Power BI and bridge the finished marts to the client's Azure Synapse
Stack
What comes out
What you see
One warehouse now powers eight reporting areas in Power BI: website behavior and search, social activity, e-commerce across digital shelf, price monitoring, ratings and reviews, and per-retailer sales, the B2B site, PowerSport popup-store sales and licenses, CRM adoption, product content, and the learning platform.
Marketing no longer assembles numbers by hand, and executives and country teams read the same self-updating dashboards. Because every dashboard sits on the same shared data layer, a single change to how the raw data is handled flows through to all reports at once, so everyone is always looking at consistent, up-to-date numbers.