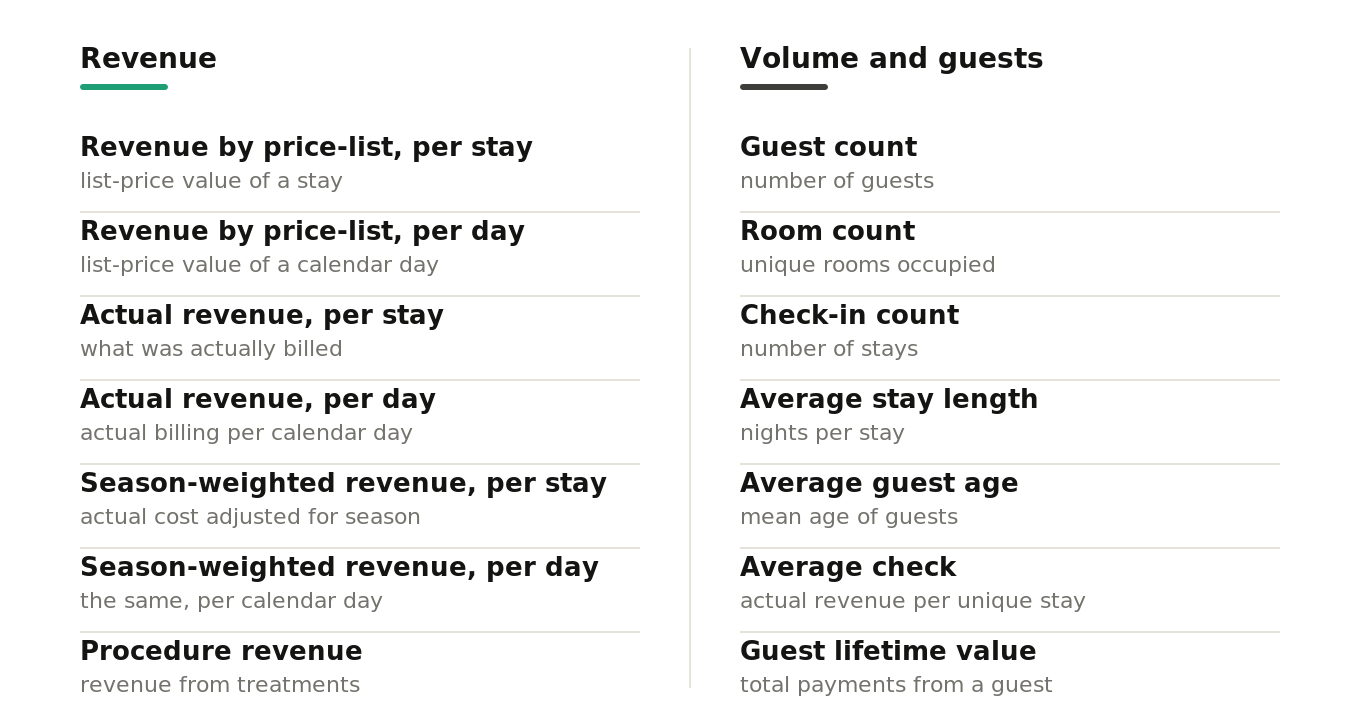
Three teams. Three definitions of 'revenue'. Three sets of dashboards. One problem.
Data governance, naming conventions, and metric maps that make sure 'revenue' means one thing across the organization. The foundation that makes BI, attribution and personalization trustworthy.
Discuss a pilot →Quick facts
- Business size
- Mid-market and enterprise, operations with cross-functional analytics consumption
- Timeline
- 6-10 weeks initial, ongoing maintenance
- Budget range
- Initial engagement from €30k. Ongoing maintenance retainer.
- Hardware
- None, methodology and documentation work.
- Data needed
- Access to your analytics / BI / data infrastructure. Stakeholder interviews.
- Evolution
-
- Genesis
- Custom-built
- Product
- Commodity
No product gives you this. We assemble and train it around you.
What this scale means
Further right means more proven and cheaper. Further left means newer and riskier. Here is the test for each step.
- Commodity
- You could get the result yourself from a ready service, with almost no work. We rarely take these on.
- Product
- A vendor already sells this result turnkey, like shelf recognition from Trax or document reading from ABBYY. If one of them fits you, use it. You come to us when it does not: when it has to run on your own servers, cost less, or fit systems the product cannot reach.
- Custom-built
- Vendors sell only the parts. A tool like Tableau hands you charts, but the dashboards and metrics for your business still have to be built. That build is the work, and that is us.
- Genesis
- The approach exists but does not work reliably yet. You are betting on it maturing, so it costs more and carries more risk.
Expected outcomes
The Problem
“What’s our revenue this quarter?” Three teams give three different answers. Marketing reports revenue as gross sales. Finance reports revenue as recognized revenue. Product reports revenue as in-app purchase value. Each is correct in its own context. None align. Leadership meetings open with reconciliation arguments.
The problem repeats for “active users”, “conversion”, “churn” and “engagement”. Every important metric carries an implicit definition that varies by team. Without explicit governance, the BI tools, the CDP and the attribution analytics all produce numbers that don’t agree.
The fix is unglamorous: write down what each metric means, agree on definitions, codify them in the warehouse, document the data model. We’ve written about this at length in pieces on naming and documenting analytics events, naming conventions, and a Minimal Modeling case study. The work isn’t technically hard. It’s politically and organizationally hard.
What the Solution Does
A structured engagement to define your data governance.
- Metric inventory. We list every important metric, where it’s measured and who consumes it.
- Definition workshops. Stakeholders agree on canonical definitions.
- Naming conventions. Events, metrics, dimensions and cohorts get consistent names.
- Data model documentation. We make the warehouse schema navigable.
- Metric map. We chart the relationships between metrics: dependencies and derived metrics.
- Ongoing maintenance. Quarterly reviews. New metric definitions follow the established conventions.
Where It Fits
This makes sense if you:
- Have several teams consuming analytics across functions.
- See real cost from “whose numbers are right?” debates.
- Are about to invest in BI, attribution or CDP. Governance first makes those investments pay off.
- Have a senior stakeholder willing to drive cross-team agreement.
This is probably not the right time if you:
- Have a small organization where one person owns all analytics.
- Cannot get executive sponsorship for cross-team metric agreement. This is political work.
- Are looking for tooling. Governance is methodology, and software alone does not deliver it.
Business Value
Trust in numbers. When metrics have agreed definitions, debates about “is this right?” stop. Conversations shift to what to do given the data.
Onboarding speed. New analysts and dashboard consumers get up to speed faster with documented definitions.
Foundation for everything else. BI dashboards, attribution, CDP, personalization, ML models, all become more reliable when metric definitions are consistent.
Compliance and audit support. Regulatory contexts require defined metrics; the metric map serves audit needs naturally.
How It Works
We use the Minimal Modeling methodology and our internal naming-and-documentation playbook.
1. Metric inventory
Interviews with stakeholders across functions. What metrics they use, where the numbers come from, what decisions depend on them. We build a map from each metric to its consumer to the decision it drives.
2. Definition workshops
Cross-functional sessions. “Revenue” gets defined explicitly: which transaction states count, how refunds are treated, what time zone, what cohort. Definitions get committed to a canonical document.
3. Naming conventions
Events, metrics, dimensions, cohorts, consistent naming. We use the Minimal Modeling vocabulary (anchors, attributes, links) plus naming patterns we’ve documented.
4. Data model documentation
The warehouse schema gets explicit documentation. Each table, each field, each metric calculation gets a description. We typically use a structured tool (Grist or a wiki) that business users can browse.
5. Metric map
A document, or an interactive map, showing how metrics relate. “Lifetime value” depends on “monthly recurring revenue”, “churn rate” and “discount rate”. When one definition changes, the downstream metrics surface as affected.
6. Ongoing maintenance
Quarterly review: new metrics defined, deprecated metrics retired, definitions updated as the business evolves. Without ongoing maintenance, governance drifts.
Stack
Methodology-first: Minimal Modeling for the schema, structured documentation in Grist or a wiki, integration with your BI tool (Metabase, PowerBI, Looker, most support metric definitions natively).
What You Need to Make This Work
Data. Access to your analytics / BI / data infrastructure.
Integrations. Stakeholder interviews. BI tool integration (where supported).
Hardware. None.
Team. Executive sponsor. Stakeholders from each consuming function. Data engineer for codifying definitions in the warehouse.
Implementation Roadmap
1. Initial engagement (6-10 weeks)
Inventory, definition workshops, documentation, naming conventions. Output: a comprehensive metric map, a naming-convention document, and definitions committed to the warehouse.
2. Ongoing (quarterly)
Definition reviews, new-metric additions, deprecations. Lightweight maintenance retainer.
Keep in Mind
- Political work. Different teams have different incentives in metric definitions. Getting agreement is the hard part. Executive sponsorship is non-negotiable.
- Documentation drifts. Without quarterly maintenance, the work decays. Ongoing investment is critical.
- Naming conventions feel pedantic. Until you’re trying to onboard the third analyst who can’t tell which “session” field is the right one. Convention discipline pays back over time.
- Minimal Modeling is opinionated. We use it because it works well for LLM-friendly schemas and human-readable documentation. Alternatives exist (dbt-style semantic layer, OLAP cubes); we discuss.
- Tooling matters less than discipline. Great tools without discipline produce drift; modest tools with discipline produce reliable governance.
FAQ
What’s Minimal Modeling?
A schema-design methodology from minimalmodeling.com. We did not invent it, but we use it heavily. It works in anchors (entities), attributes (their properties) and links (relationships). It produces schemas that are easy for humans and LLMs to navigate.
Is this just dbt’s semantic layer?
Related but broader. dbt’s semantic layer is a tool for codifying metric definitions in SQL. Data governance covers the methodology, the cross-team agreement, the documentation and the ongoing maintenance. The tool is one part of a larger whole.
How does this differ from a metric-catalog product (Cube, Lightdash, dbt Cloud)?
Commercial metric-catalog tools are excellent for implementation. Our approach is the methodology that those tools support, the part that vendor tooling can’t solve (cross-team definition agreement, naming conventions, ongoing governance discipline).
Can you implement this just inside our BI tool?
Most modern BI tools (Metabase, PowerBI, Looker) support metric definitions. We implement in your tool of choice; the discipline is the value.
Ready to Discuss?
If your organization has cross-functional analytics consumption and your metric definitions are implicit and inconsistent, this is foundational work. We’ll walk through your current state and your political readiness, and tell you what to expect.