Self-Service Analytics for a Health Resort
A clean analytics warehouse and dashboards over a resort's booking system, so the team reads bed-day economics and builds its own reports.
Where the data comes from
Sources we pull
A sanatorium-style health resort runs on a resort-management system backed by an Oracle production database. It holds every guest, service and transaction.
To see how the business was doing, staff pulled that data into Excel by hand. They built reference tables by hand to aggregate it. Bed-day economics, the core unit of resort revenue, were the painful part. Source records had gaps, and prices depended on which price-list applied on which date. Every report meant repeating the same manual work.
What we do with it
The data layer
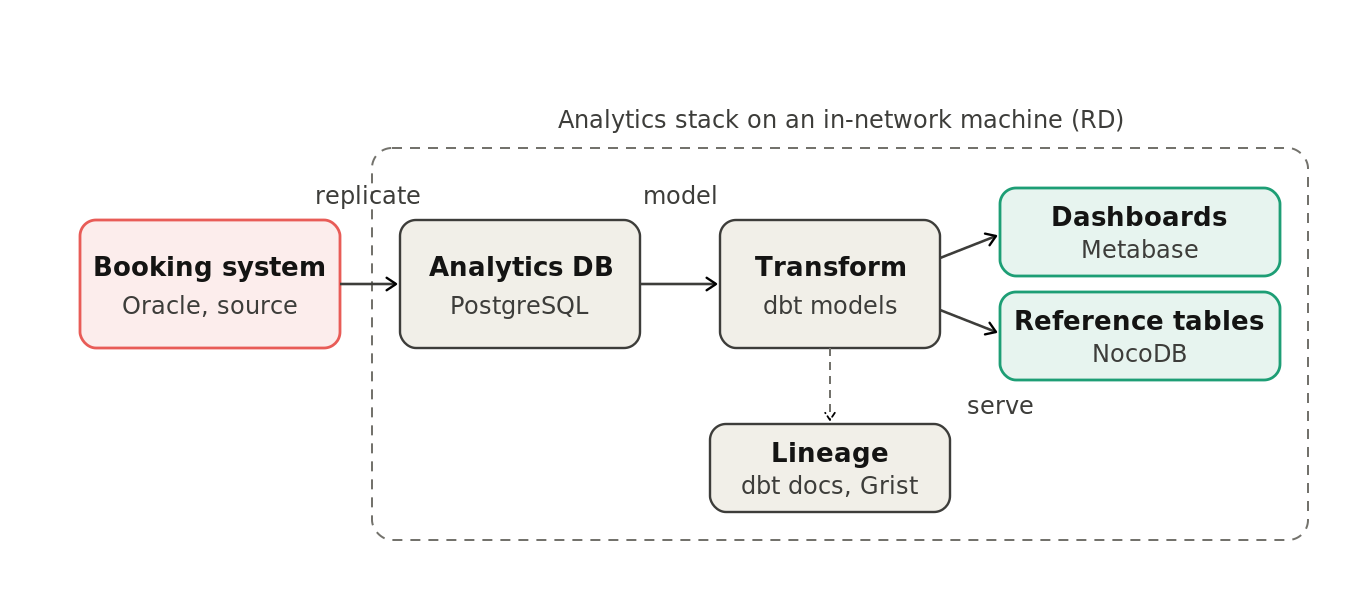
We stood up an analytics layer next to the booking system, on a machine inside the resort network. The booking system itself is never touched.
Data copies from the Oracle production database into a separate PostgreSQL database. There, dbt models clean it and shape it into the things the business talks about: orders, guests, check-ins, bed-days, bills and payers.
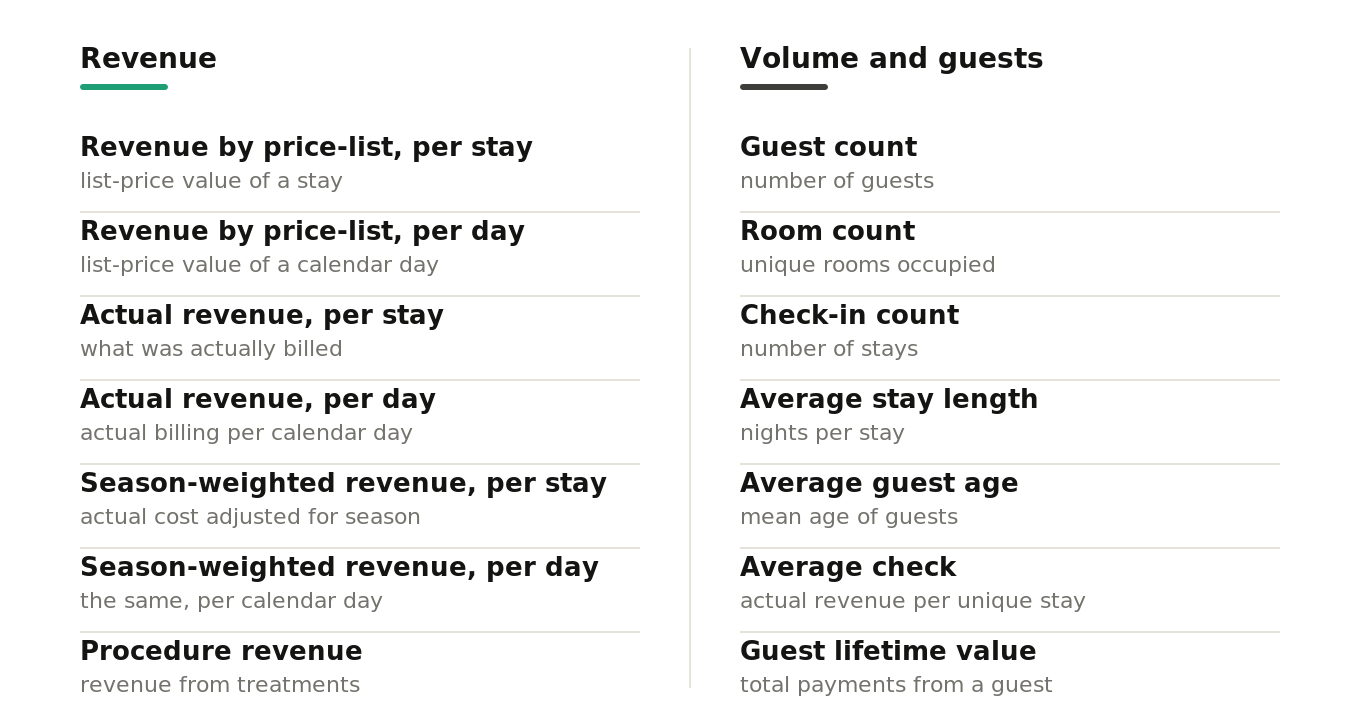
Bed-day costing is the hard part. Source records have gaps. The models fill missing room, board or treatment fields by rule, and pick the right price-list by the dates that applied. Each bed-day then carries three figures: its actual price, its standard price-list price, and a season-weighted average.
Reference tables are edited in NocoDB, and every metric's lineage is documented so anyone can trace a column back to its raw source. We also ran hands-on training, so staff build their own dashboards and queries.
- 01 Replicate data from the Oracle production database into a PostgreSQL analytics database
- 02 Model and clean it with dbt into staging and a BI layer
- 03 Compute bed-day economics: actual price, standard price-list price, season-weighted average
- 04 Edit reference dictionaries through a table UI (NocoDB)
- 05 Document every metric's lineage in dbt docs and catalog the model in Grist
- 06 Serve dashboards and self-service queries in Metabase
Stack
What comes out
What you see
The resort now has one source of truth and a documented set of metrics on top of it. The hand-built Excel files are gone.
Fourteen metrics sit on the model, from revenue and occupancy to guest lifetime value. They feed six dashboards: stays, orders, daily views, procedures and a per-guest card. After training, staff read these dashboards and build their own, so bed-day costing runs the same way every time.