ACI: Computer Vision for Cargo Inspection at Warehouses

- Seed
- PoC
- MVP
- Production
- Chasing perfect
An automated intake station that photographs every shipment from all sides, sorts the packaging, finds damage and measures size from a 3D scan, all in under fifteen seconds.
Where the data comes from
What we capture
When cargo arrives at a warehouse, damage that nobody writes down turns into lost trust and costly fines later. Checking by hand is subjective, and people get tired and miss things.
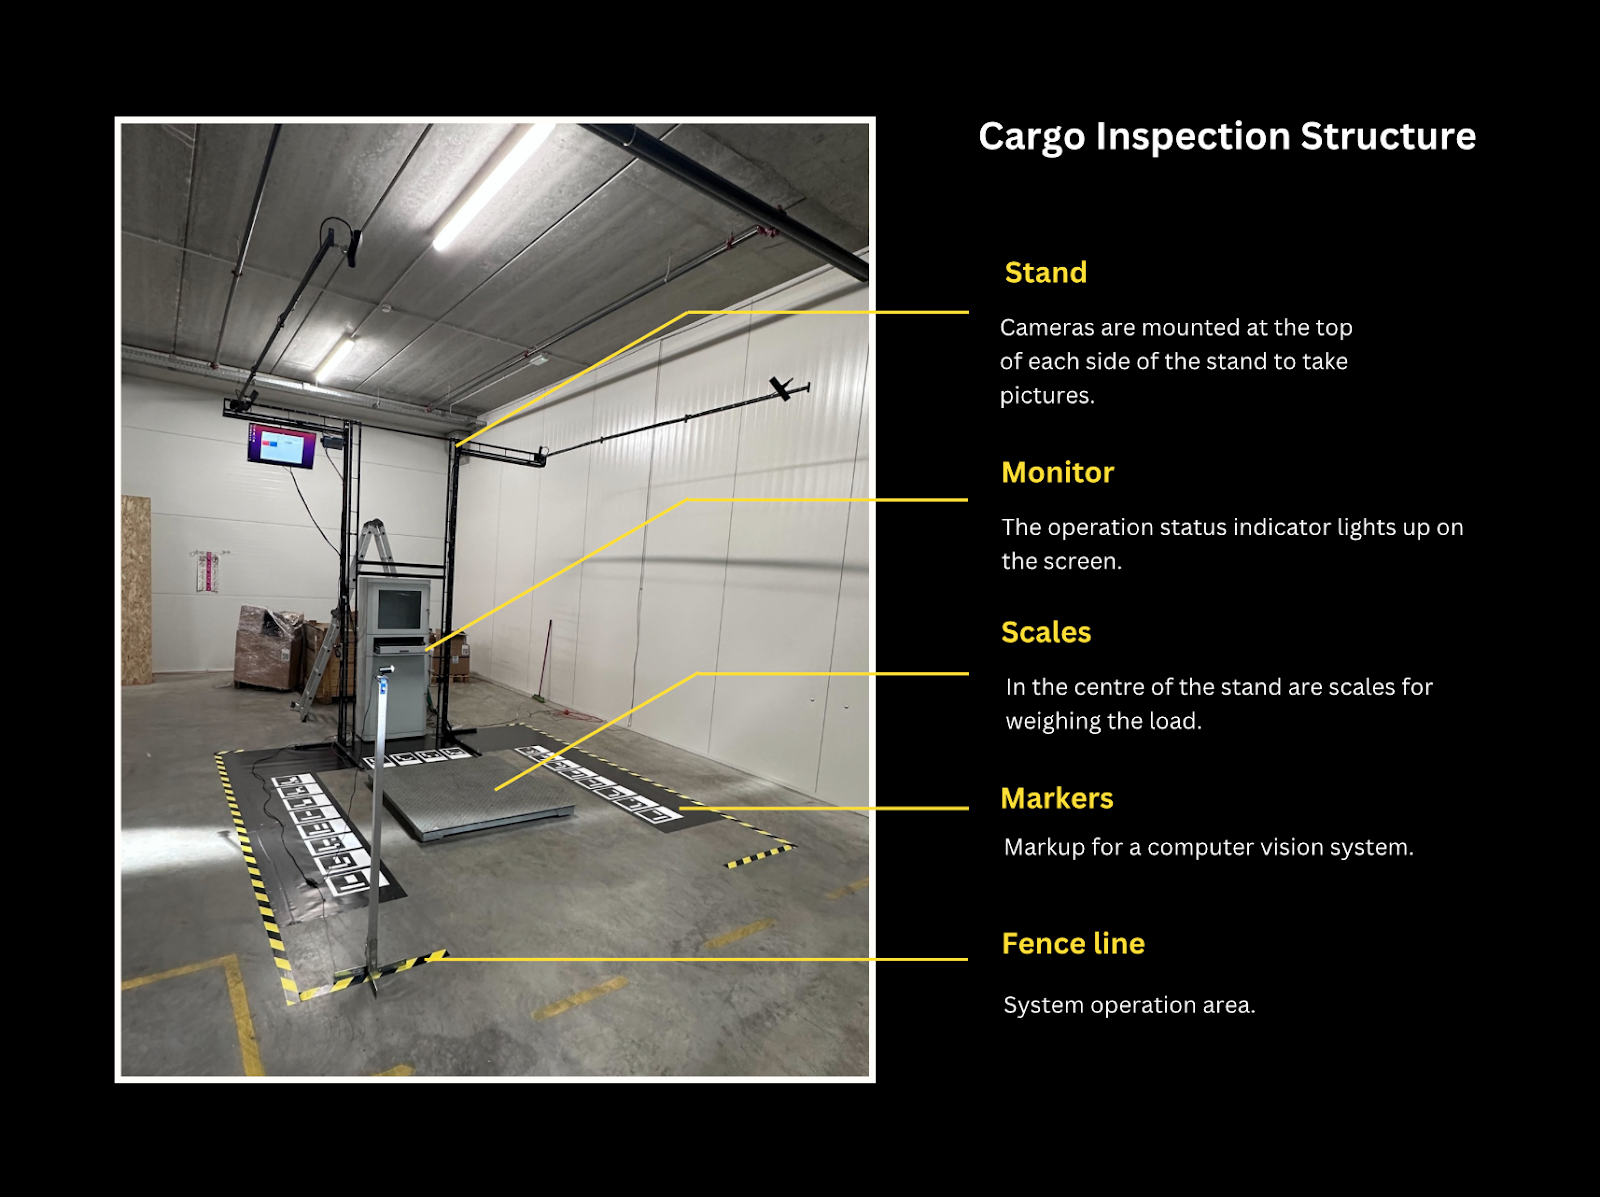
ACI wanted every arriving shipment recorded the same objective way every time: the packaging, any damage, the size, the weight and the number of units. So each shipment is weighed and photographed on a metal stand ringed with cameras that see it from every side, tied to a QR code, with a simple on-screen workflow for staff. A full inspection takes under fifteen seconds.
The hard part is the variety. New customers arrive every week with packaging nobody has seen before: cardboard boxes, rolls, wooden crates, bags and film-wrapped versions of each, plus a dozen kinds of damage from tears to punctures.
What we do with it
How we train
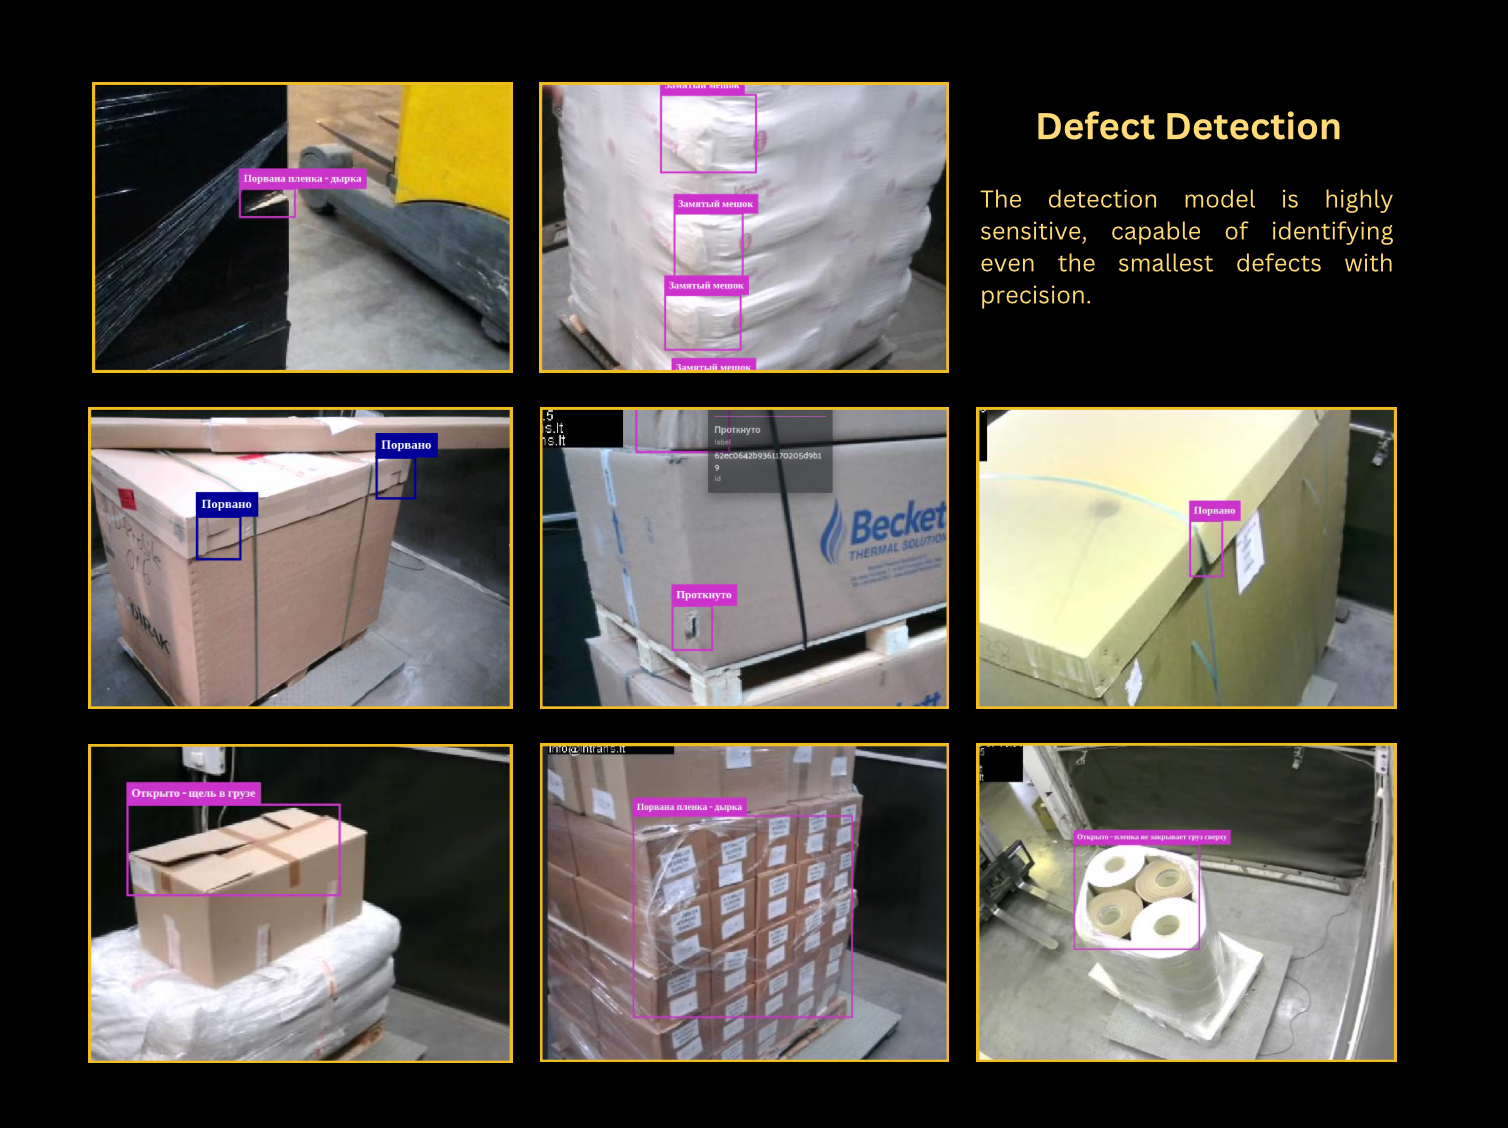
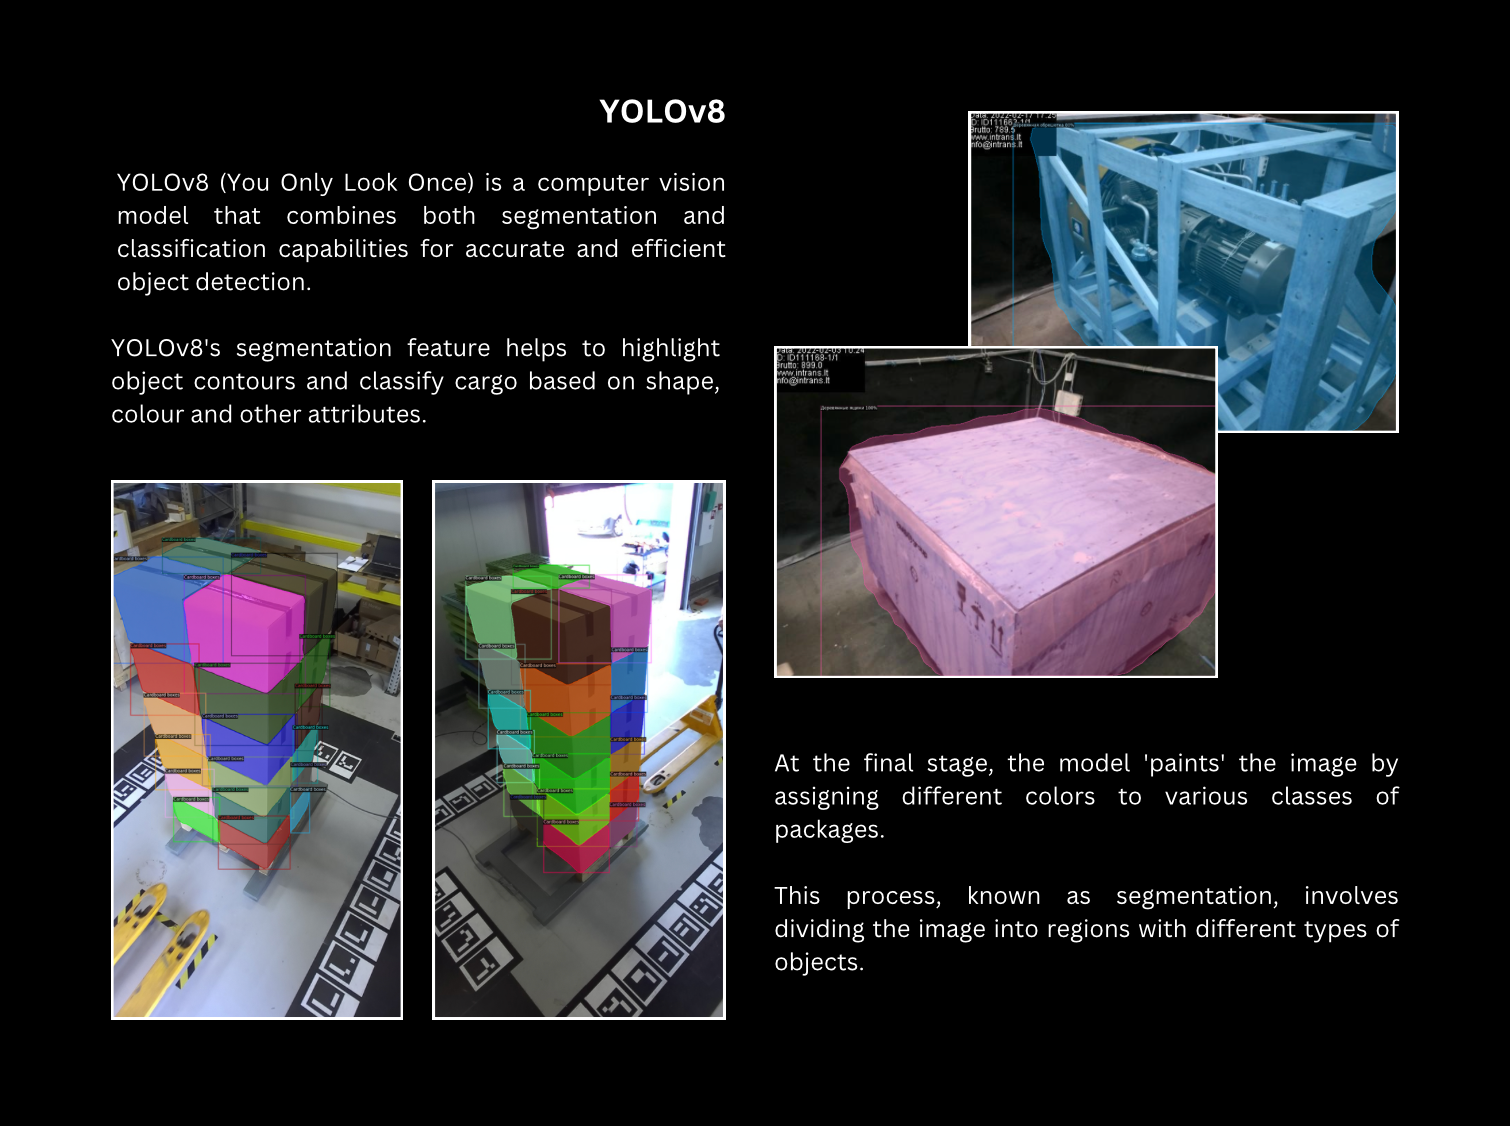
Each shipment runs through two models. A YOLOv8 segmentation model sorts the packaging type and outline; a YOLOv5 detection model finds damage such as tears, holes, crumples and punctures. Their results are combined so every defect is pinned to the exact spot on the package.
From the photos, depth data and small printed markers that tell the cameras where they are, the system builds a 3D scan to measure the size and count the units inside. Everything is tied to the QR code into one shipment record.
Because ACI keeps adding customers with new packaging, retraining had to be cheap. A Datapipe pipeline takes in only the new or changed data and updates the models without rebuilding the whole dataset from scratch.
- 01 Weigh and photograph the shipment from all sides, tied to a QR code
- 02 Sort the packaging type and outline (YOLOv8)
- 03 Find surface damage (YOLOv5)
- 04 Combine the results so each defect is mapped onto the package surface
- 05 Build a 3D scan, using printed markers, to measure size and count units
- 06 Create the shipment record and retrain weekly with Datapipe
Stack
What comes out
How it performs
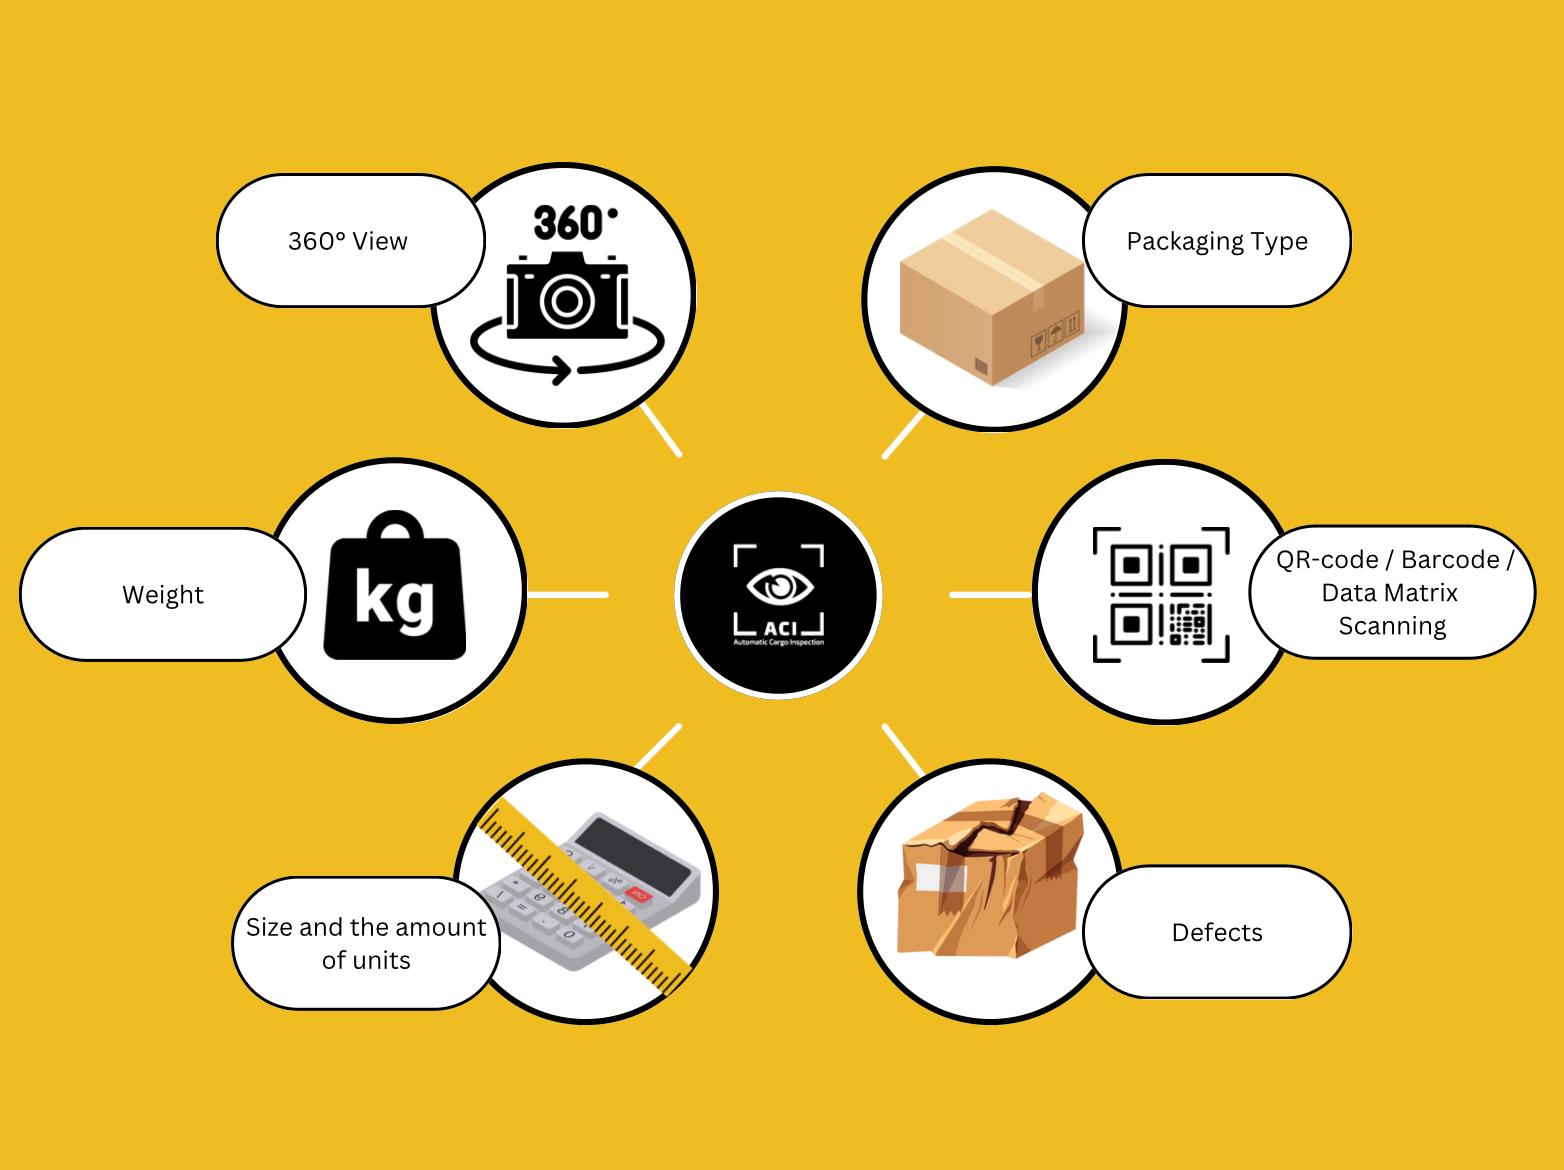
Every shipment is now checked against the same standard, so the result no longer depends on who is on shift or how tired they are. The station photographs each arrival from every side, sorts the packaging, flags twelve types of damage, measures size from the 3D scan, counts the units and writes one record per shipment.
The Datapipe retraining loop lets it absorb new packaging as ACI signs up customers. On a newly added green-pallet type, the F1 score reached 0.7 to 0.8 right after retraining. F1 is a single accuracy figure between 0 and 1 that balances how often the model is right against how often it misses.