Zerion: Analytics Pipeline for Wallet Events at Scale

A data pipeline that turns up to 100 million daily wallet events into clean, ready-to-read tables, so the business can measure app and partner-API usage in one place.
Where the data comes from
Sources we pull
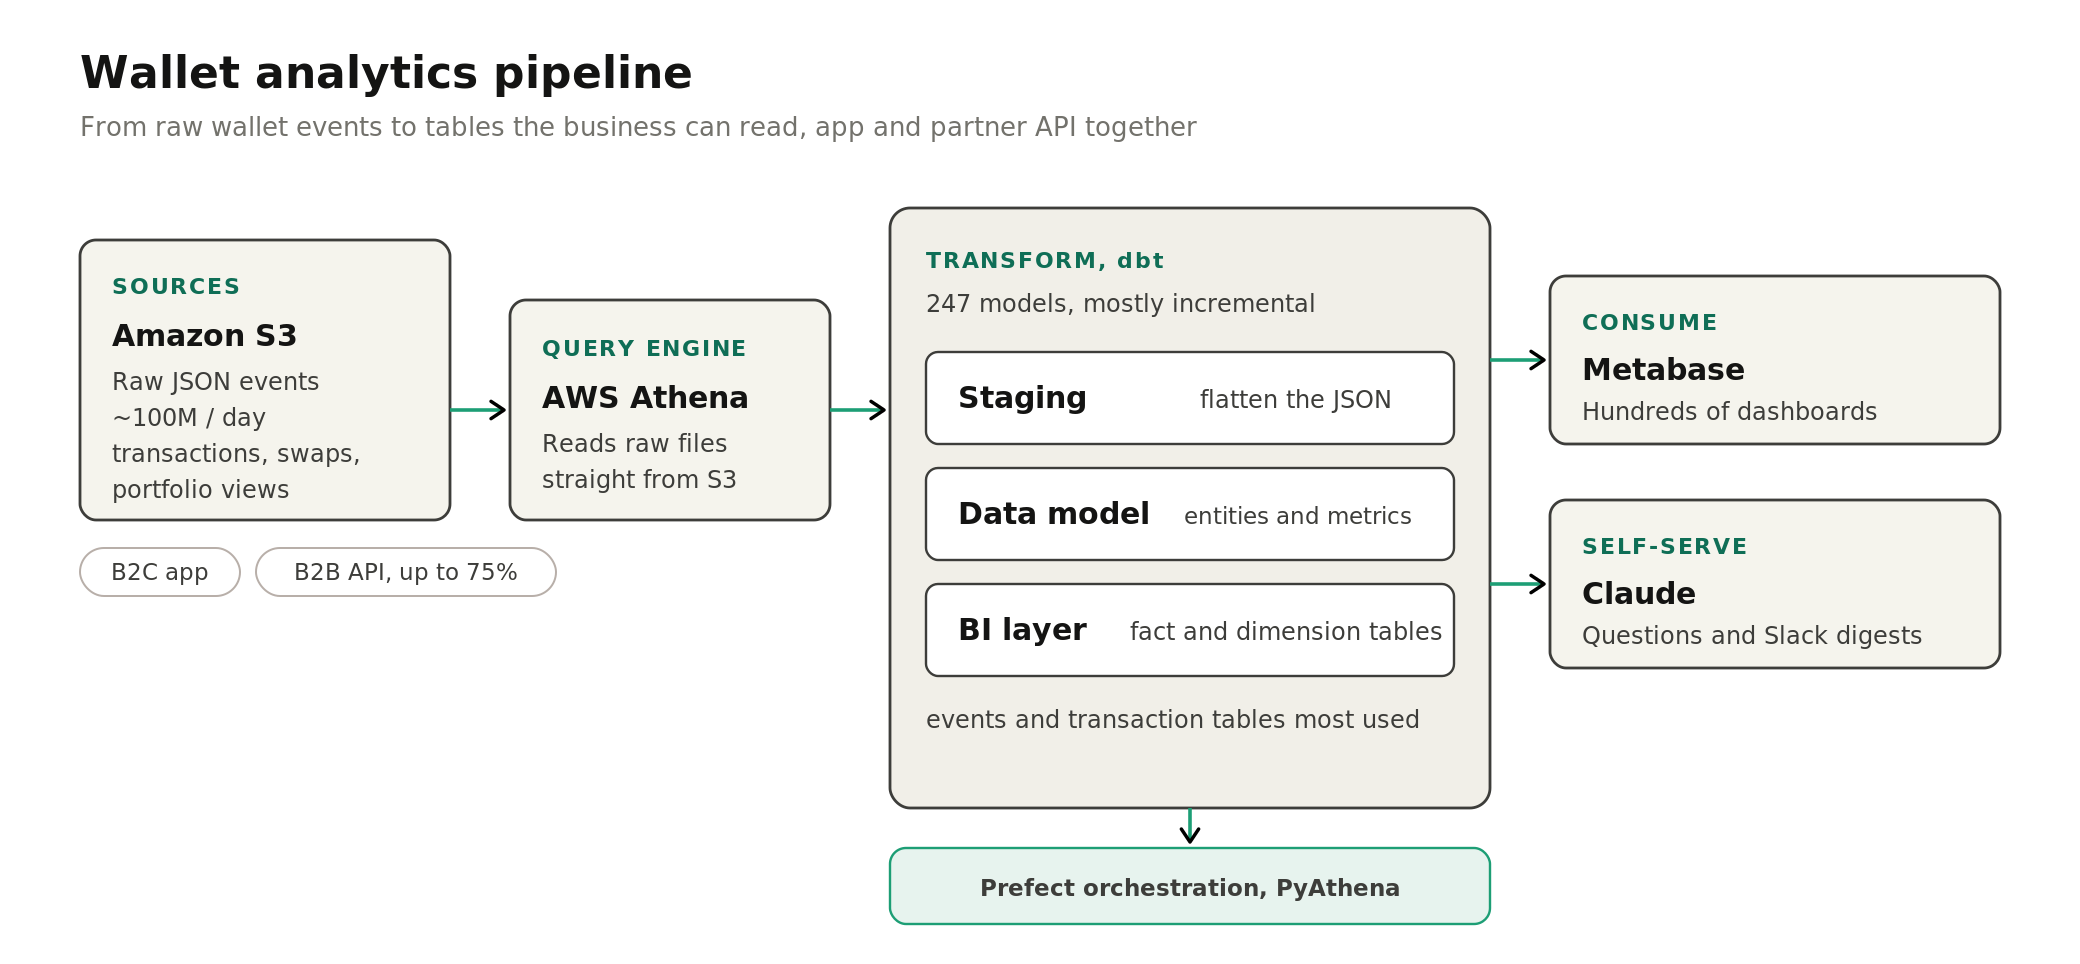
Up to around 100 million wallet events a day pour out of Zerion's apps and data API: every tap, swap and portfolio view. They land as raw files in cloud storage (Amazon S3).
The problem was reading them. Tools like Mixpanel cover the app, but they leave out the data Zerion sells to partner companies over its API. That traffic is up to 75% of the volume, so the largest part of the business was invisible.
How we build it
The data layer
A query engine (AWS Athena) reads the raw files straight from storage, so nothing is copied first. A chain of transforms (built with dbt) then cleans them in steps: it untangles the raw files into neat columns, shapes them into wallets and transactions, and rolls those up into summary tables ready for reporting.
New events only ever get added, so each run touches only the new data. That one choice fixed the slow, failing jobs the raw volume used to cause. In all it is about 247 transforms, run on a schedule (Prefect).
- 01 Raw JSON events land in Amazon S3
- 02 Athena exposes raw events as external tables
- 03 dbt staging parses and flattens the JSON
- 04 Data model layer builds wallet and event entities
- 05 dbt BI layer builds aggregated fact and dimension tables
- 06 Metabase dashboards and Claude self-service
Stack
What you get
What you see
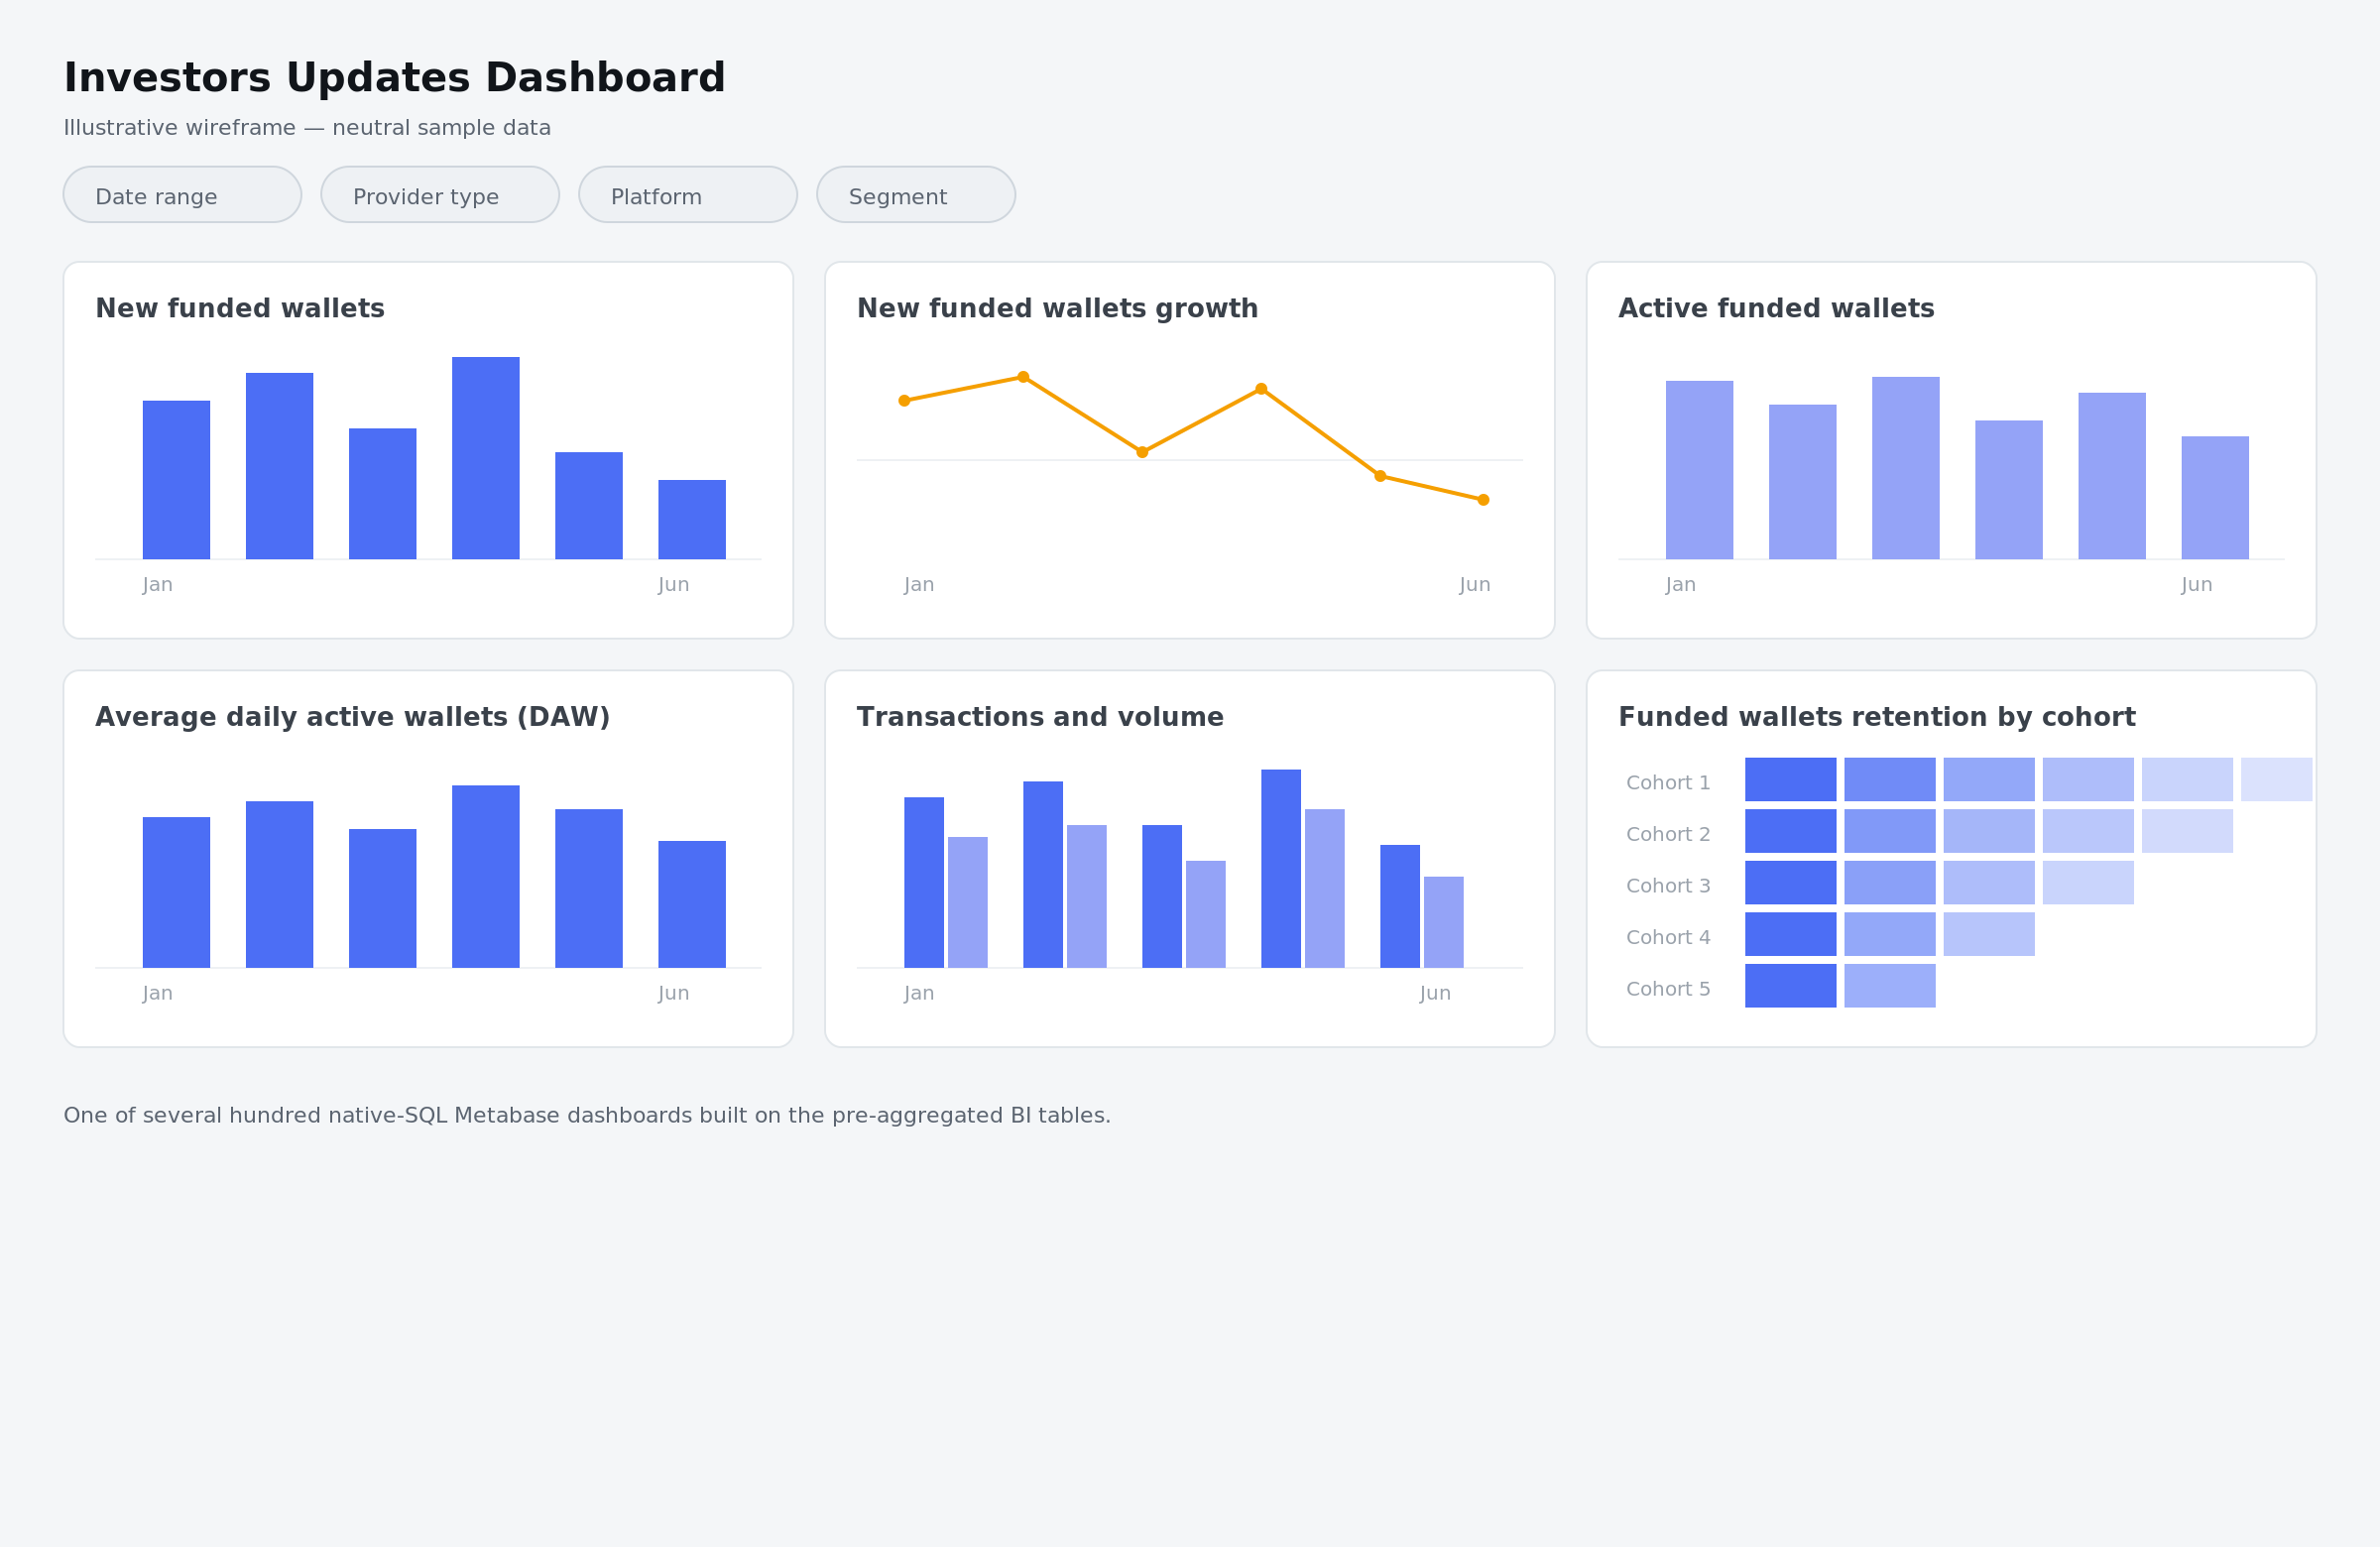
Reporting that did not exist before now runs on these tables. Hundreds of dashboards (in Metabase) sit on top of them, covering both the app and the partner API.
Business users answer their own questions over the ready tables with Claude, and a Claude assistant posts a daily usage summary to Slack, so the team stops checking dashboards by hand.