Live Quiz Operator: Exploratory Data Analysis of Players and Market
We took a live quiz operator's player surveys and market numbers, cleaned up the mess, and went looking for what makes a game night good and where the business is winning.
Where the data comes from
Sources we pull
A live quiz operator runs bar trivia nights in several cities. After each game players rate four things, the questions, the host, the organization and the bar, and can leave a comment. Next to that sits market data: how many teams played, the operator's own and every rival's, city by city over a year.
The data was all there, just messy. One city alone turned up spelled five different ways, game names had no standard, and the same game number meant different games in different cities. So before any analysis came a round of spell-check, until the rows finally lined up and could be counted at all.
How we build it
The data layer
Most of the work is making the data trustworthy before any finding. We lined up the city and game names and added columns for weekday, hour and month. Then we built measures the survey never records directly: a question-quality score (did players enjoy the questions, given how hard they were), how much scores disagreed within a team, comment length, and where the team placed.
With that in hand we ran the statistics, and kept them simple. Correlation (how closely two things rise and fall together) ranked what moves the overall score. We tagged the free-text comments by topic, to check the numbers against what people actually wrote. A t-test asked whether the format change really moved scores or just looked like it. And for market share we drew a trend line for each city and read its slope, which shrugs off a single lucky or bad month that a crude December-minus-January gap would fall for.
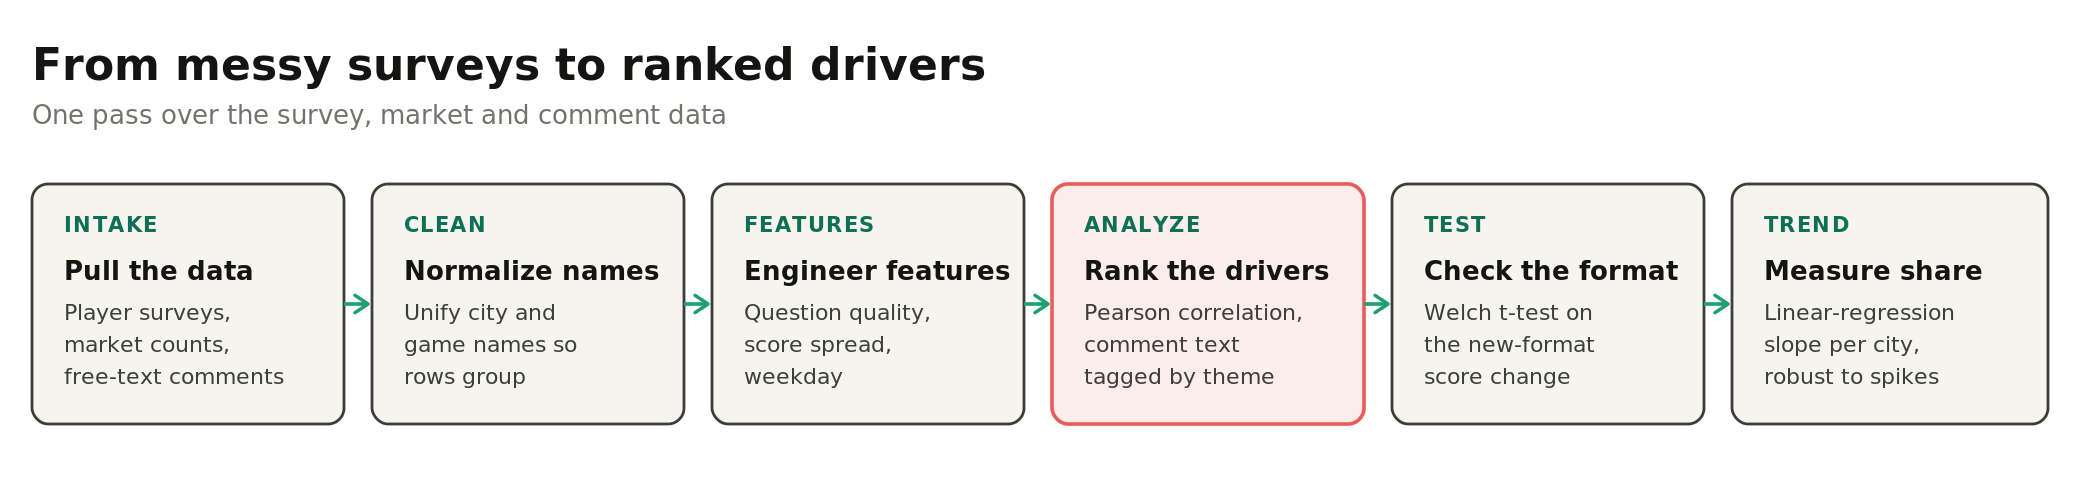
- 01 Survey, market and comment data intake
- 02 Normalize city and game names
- 03 Engineer features (question quality, score spread, weekday)
- 04 Pearson correlation and theme tagging of comments
- 05 Welch t-test on the format change
- 06 Linear-regression share trend per city
Stack
What you get
What you see
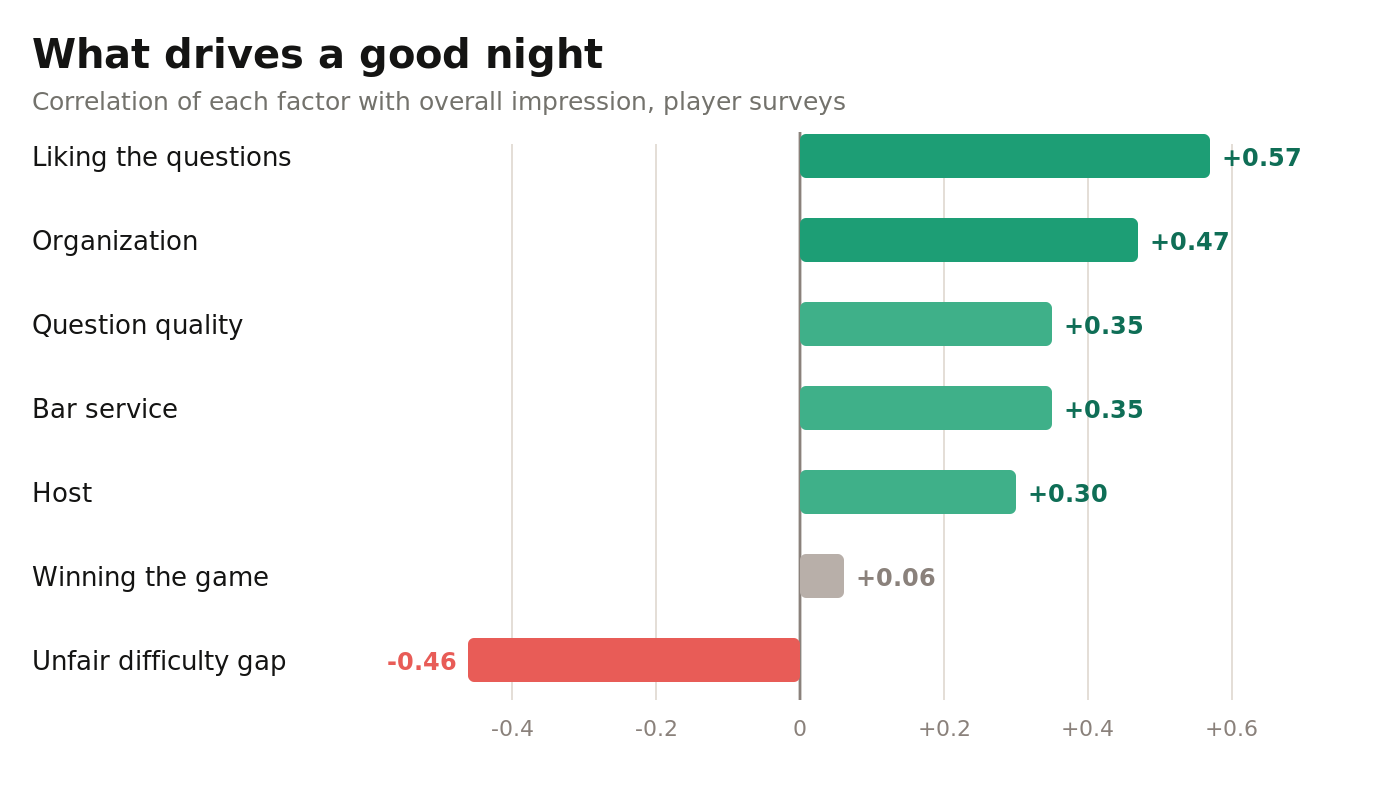
The questions make or break the night. How much players liked the questions is the strongest driver of a good evening (correlation +0.57), ahead of organization (+0.47), question quality and the bar (+0.35 each) and the host (+0.30). Winning barely shows up (+0.06) and final place not at all, so people come for the evening and the scoreboard barely figures. A slow bar will ruin a night faster than losing ever could.
The fastest way to spoil a night is an unfair question. A fair hard question can be worked out: a clue, a twist, a fact you can piece together. An unfair one just asks whether you already knew it, with no way to reason your way there. That gap, hard but no fun, is the single biggest drag on the score (correlation -0.46), and the comments say the same, asking for the answer to be explained afterwards. The rest lines up: a lively host adds about a point to the average (9.08 versus 8.04), and questions that feel "too clever" cost around a point and a half.
On the market, the operator runs 35-50% of all quiz teams in its cities, around 47% in its largest, and there is no busy or quiet season to explain it away. Late in the year, themed and musical games started pulling teams from the classic format, in its own cities and in cities it has not entered yet. A reworked classic format scored a little lower with regulars (around 4-6%), while newcomers were unmoved and attendance held flat. The analysis also handed the operator a short to-do list, mainly one naming scheme for games, so the next pass is cleaner. Read it all as directional: it shows what moves together, and stops short of proving what causes what.