Marketing Attribution and a Sales Funnel for a Car Dealership Group
Ad spend, calls, and CRM deals stitched into one model that says which campaign sold which car.
where the data comes from
Sources we pull
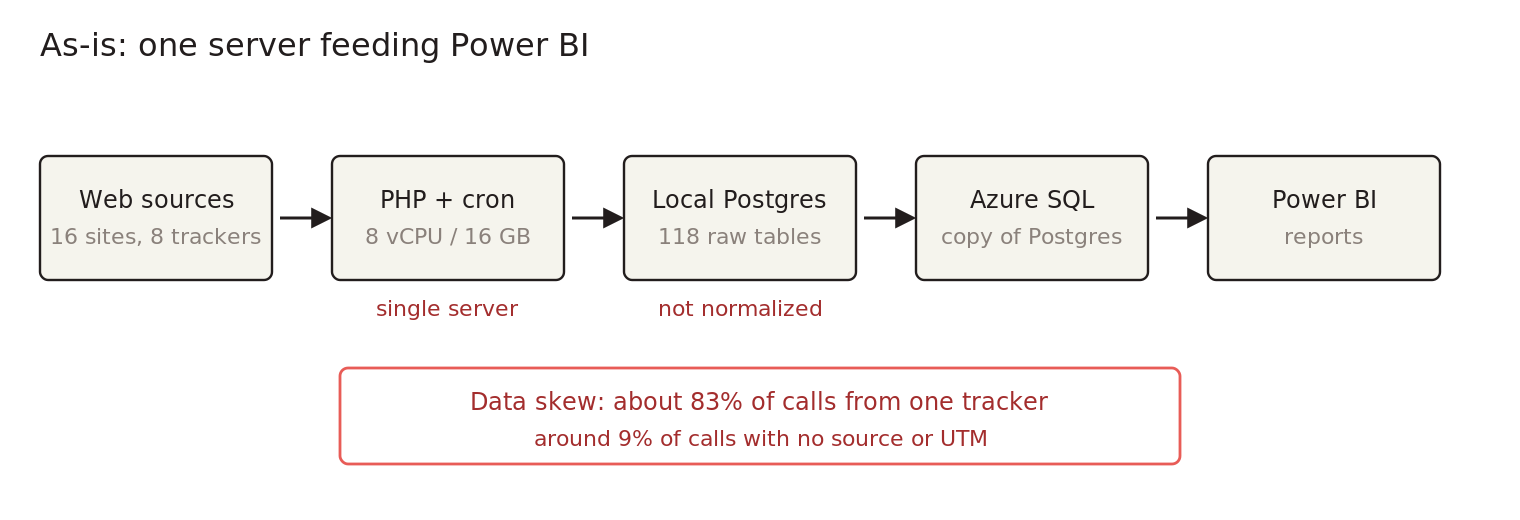
A multi-brand car dealership group sold cars across 16 dealership websites and around a dozen brands. Leads arrived through online classifieds, eight different call-tracking systems, and search advertising, while every closed deal lived in a legacy ERP. The existing analytics ran on a single server: PHP cron jobs pulled each source API into a local Postgres database, copied the data on to an Azure SQL database, and Power BI read from there. That warehouse held 118 tables, mostly raw API dumps with no shared model. The data also leaned heavily on one call tracker, about 83 percent of all calls, and many calls carried no source or campaign tag at all. Ad spend, calls, and signed deals never shared a key, so no one could say which campaign produced which sale.
what we build
The data layer
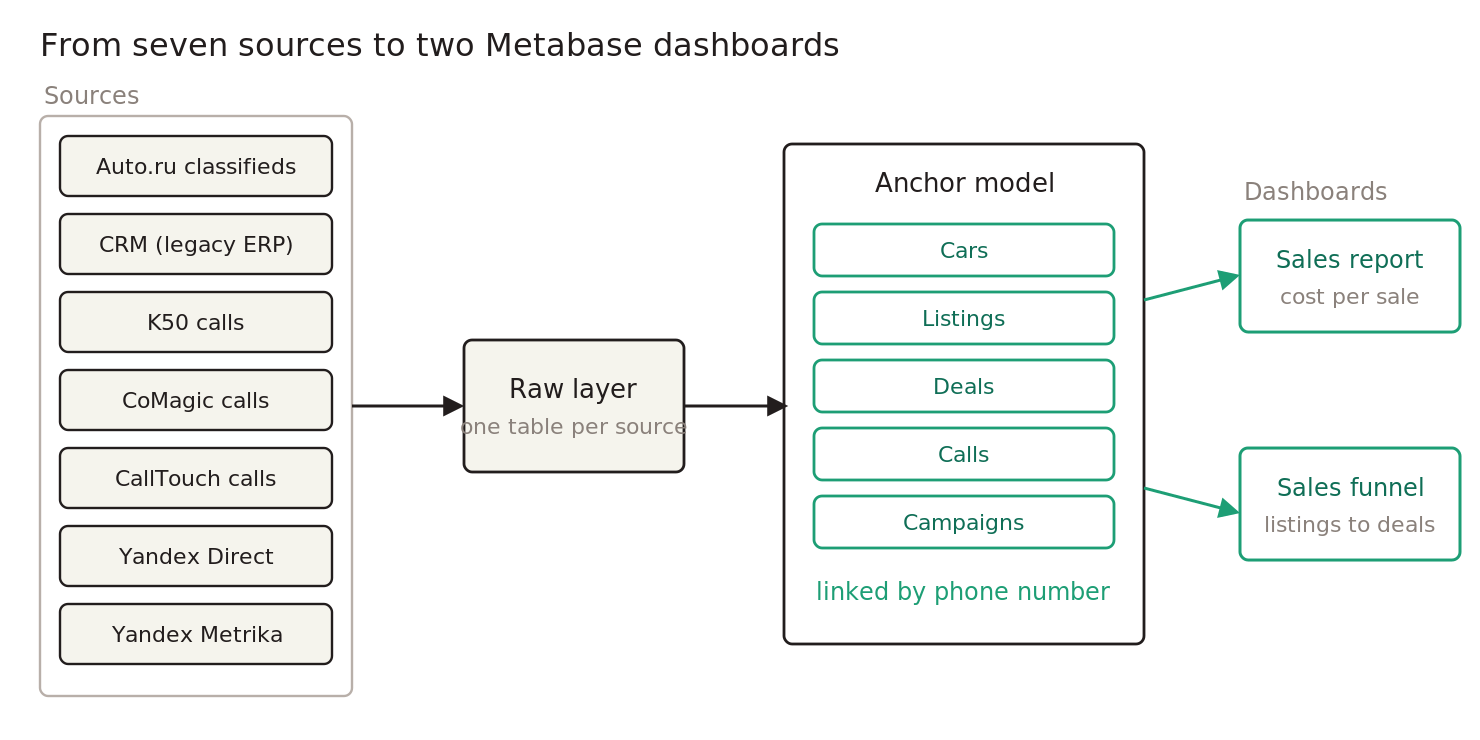
We started by auditing that stack and recommended a layered warehouse built around a single customer identity. Then we built a connector for each source into a raw data layer and described the business with anchor modeling: cars, classifieds listings, deals, calls, and ad campaigns as anchors, each with its own attributes and links between them. On top of the raw layer a staging layer consolidates deals, ad campaigns, and a phone-to-UTM bridge. The key move is stitching identities by the customer phone number, so an anonymous ad click and a tracked call connect to a closed deal in the CRM. From there a campaign table rolls everything up by unique UTM set and computes spend, sales, calls, and the cost of one sale and one call. Each source refreshes on a schedule so the picture stays current.
- 01 Source connectors: classifieds, CRM, call tracking, search ads
- 02 Raw layer ingestion from every source
- 03 Anchor modeling: cars, listings, deals, calls, campaigns
- 04 Identity stitching by customer phone number
- 05 Staging and roll-up of spend, sales, and calls by UTM set
- 06 Metabase dashboards on the BI layer
Stack
the dashboards
What you see
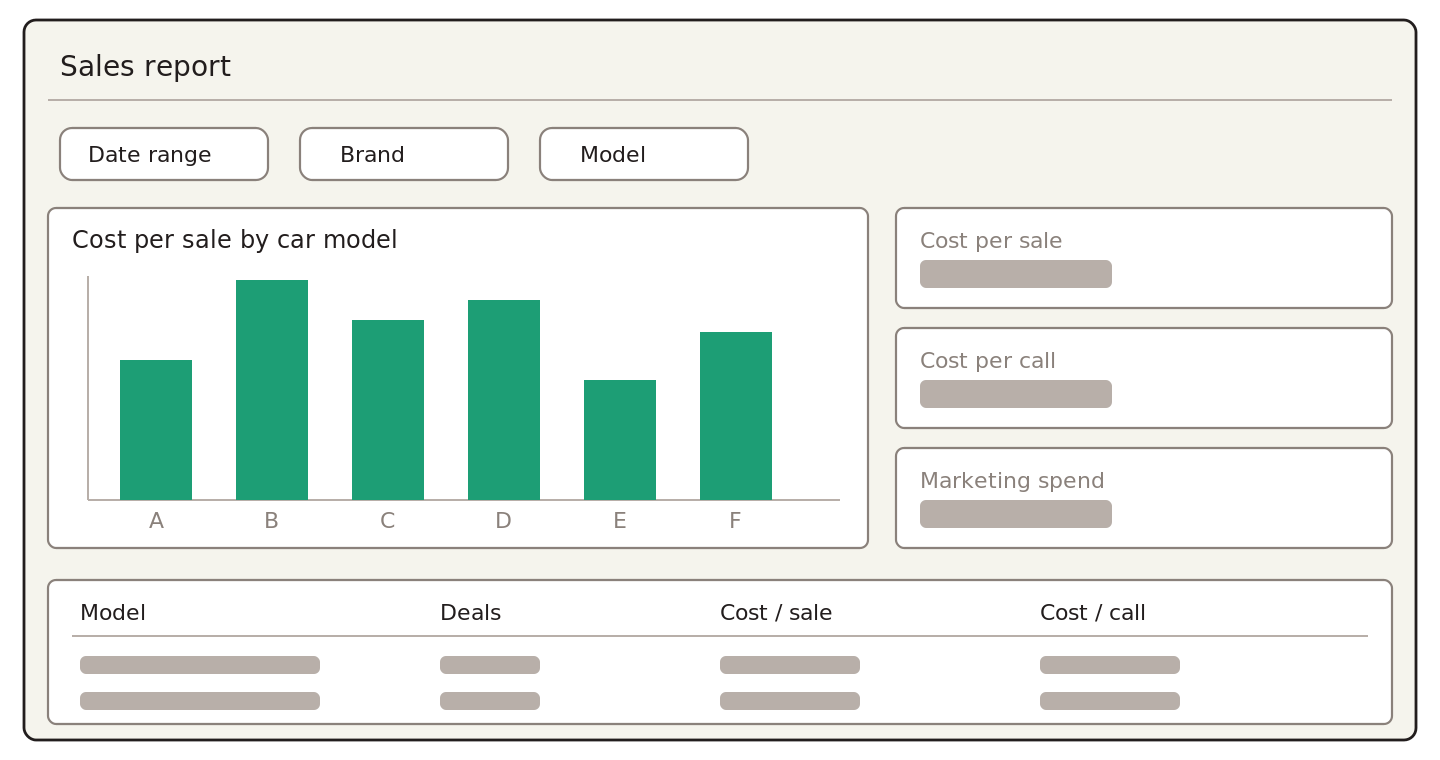
Two dashboards run in production on the BI layer. A sales report ties each deal to the campaign that drew it, showing cost per sale and cost per call by UTM set, rolled up to the level of individual car models with filters for date range, brand, and model. A second dashboard, the sales funnel, joins classifieds listings to CRM deals on the caller phone number so the team can follow a lead from a listing through to a signed contract. The result is one model where marketing spend, calls, and sales finally line up. Before, spend, calls and deals lived in systems that never agreed.